

The brand new numbers for 2018 show a positive picture. Wine production reached a record level in 2018 reaching 293 million hectolitres, a good recovery from a catastrophic 2017. The biggest wine producers in the world in 2018 are Italy, France, Spain and the USA. Global vineyard surface remained stable with Spain having the world’s biggest vineyard, China in second place, followed by France. Global consumption was also stable in 2018, following the rapid growth we have seen since the early 2000s. The USA is solidly in the lead as the biggest market / biggest wine consumer, followed by France, Italy and Germany. World trade in wine continues to expand and has more than doubled since the early 2000s. China surprised in 2018 with declining wine production and declining wine consumption. Read on for more statistics.
The world’s authority on wine statistics is the OIV (International Organisation of Vine and Wine), who collects and collates information about wine from all over the world. Their annual release of the preliminary numbers for vineyards, wine production, and wine consumption is perhaps the best indicator you can get of what is happening in the world of wine. So let’s take a look at the Wine World of 2018. The new director general, Pau Roca, has just done his first press conference on the status of wine in 2018.
You can read a shorter, more condensed version of this article with only the main points, on Forbes: Record Global Wine Harvest In 2018, Stable Consumption.

You can watch the full press conference with Pau Roca on this video (in French):
Record world wine production in 2018
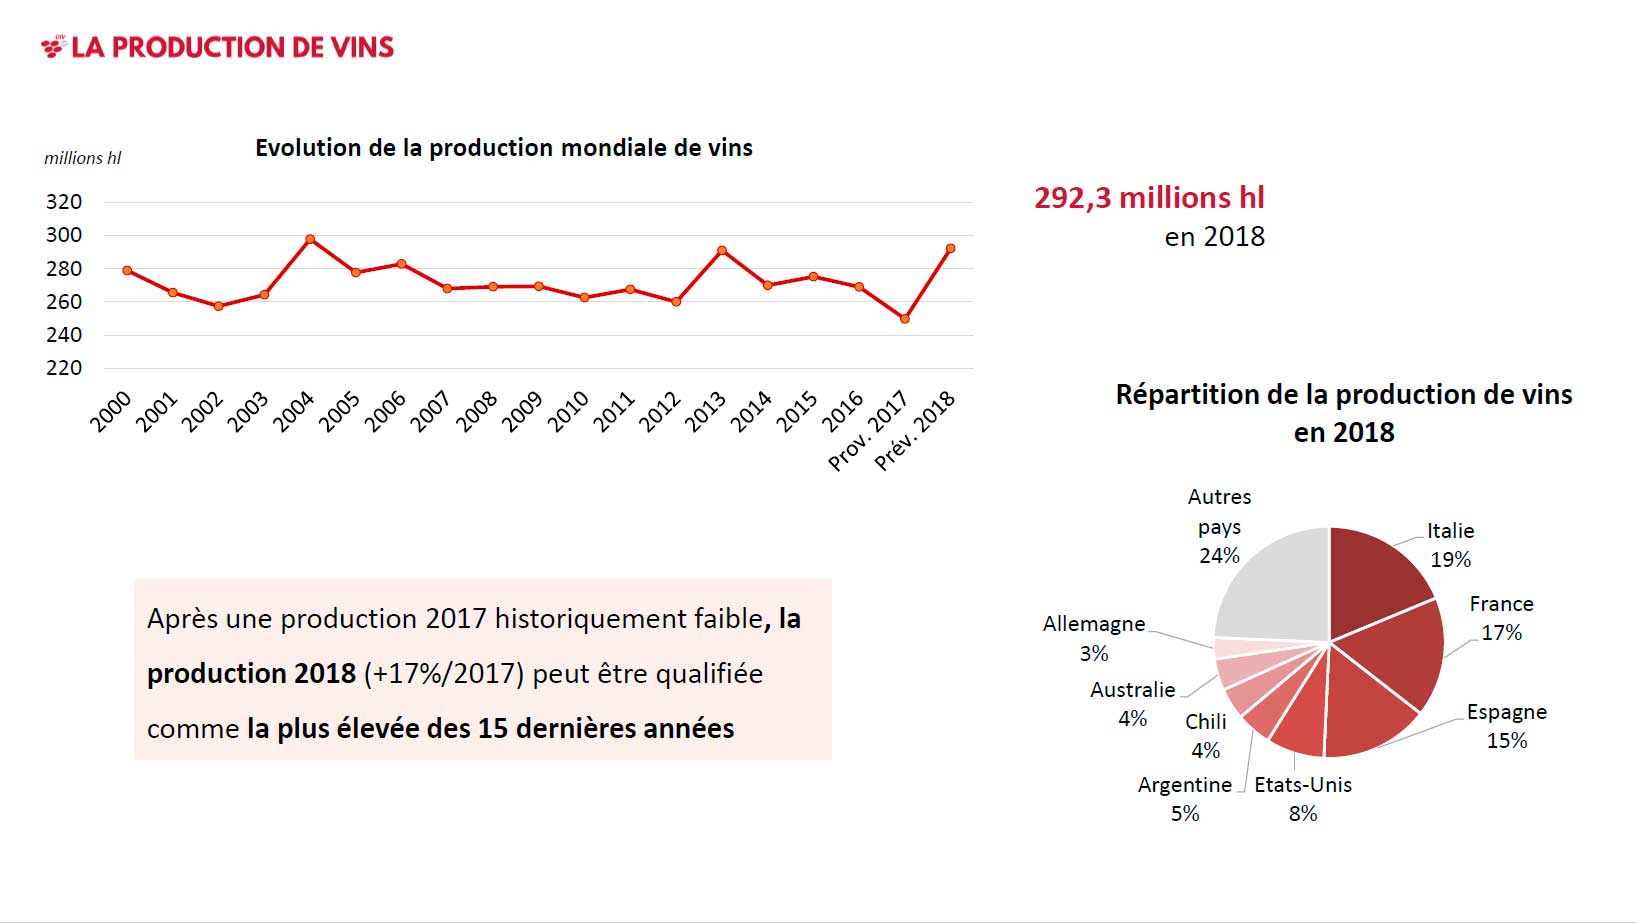
2018 was a very good year. World wine production in 2018, excluding must and juice, was a record harvest of 292.3 million hectolitres. This is the biggest wine harvest in 15 years, since 2004/2005. It is a very big increase of 42.5 M hl from 2017. However, 2017 was the smallest harvest recorded in an even longer time, due mainly to weather issues in Europe that led to much reduced yields.
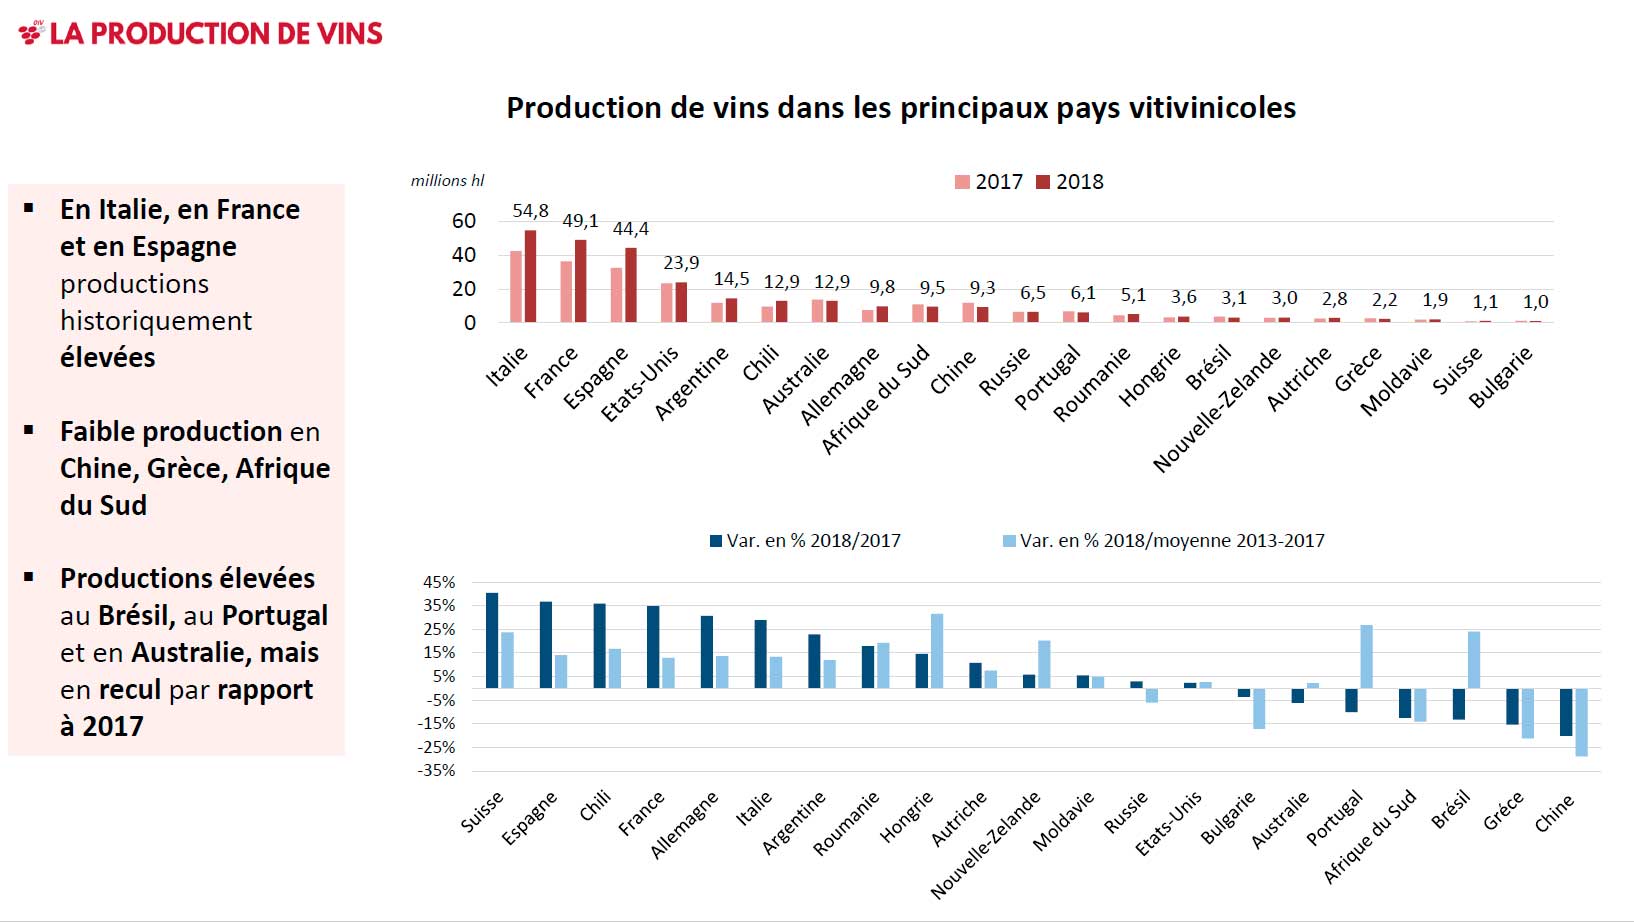
The three biggest wine producers, Italy, France and Spain all made big harvests, each of them increased the production with between 22% and 26%. Also, most other countries in Europe had harvests that were significantly bigger than in 2017.
A few countries in Europe were not so fortunate. Portugal, Russia, Greece and Bulgaria all had a smaller harvest in 2018 compared to 2017.
The longer view: global wine production is stable
The global wine harvest can vary quite a bit, mainly due to vagaries of the weather. In a longer perspective, wine production is stable, at around 270 million hectolitres annually.
Europe still dominates world wine production
Europe is still the largest wine producing continent, by quite far. The three biggest wine producers in the world, and in Europe, Italy, France and Spain, together account for 51% of world wine production. Half of all wine is made by these three countries!
In total, the European Union (not “Europe”) produced 181.9 M hl, which is then 62% of the world total. But it is a declining share and it may be just a matter of time before the ROW (rest of the world) passes Europe. One reason for this is, of course, the very restrictive regulations in Europe regarding plantations (and a history of uprooting), which makes changes in Europe very slow. It is much easier to plant new vineyards, if one can find a demand, in countries outside of Europe.
Take then the five countries following the top three in 2018: in falling order, USA, Argentina, Chile, Australia, and Germany. They account for 25% of world production, a quarter of world wine come from the top four “New World” countries, plus German. Without Germany, the four New World countries have a still honourable 22% of world wine production in 2018.
Italy retains the lead, by quite a big margin ahead of France, as the biggest wine producing country. Historically the two have battled for the top spot but Italy seems to have subscribed to it the last few years, maybe thanks to a more dynamic view on new plantings (see more below).
The USA is still solidly the fourth biggest wine producing country with 23.9 M hl, which is a small increase.
It is in the following positions, 5 to 10, that there are more changes in recent years. There are six countries that are positioned around the 10 million hl-mark and that have moved up and down in recent years. This year the order is:
- Argentina
- Chile
- Australia
- Germany
- South Africa
- China
Here is more historical information on world wine production.
| World wine Production, million hectolitres (M hl) | |||||
|---|---|---|---|---|---|
| 2018 | 2017 | Avg '13-'17 | Change '17-'18 | ||
| 1 | Italy | 54.8 | 42.5 | 48.3 | 28.9% |
| 2 | France | 49.1 | 36.4 | 43.5 | 34.8% |
| 3 | Spain | 44.4 | 32.5 | 38.9 | 36.7% |
| 4 | USA | 23.9 | 23.3 | 23.2 | 2.3% |
| 5 | Argentina | 14.5 | 11.8 | 13 | 22.8% |
| 6 | Chile | 12.9 | 9.5 | 11 | 35.9% |
| 7 | Australia | 12.9 | 13.7 | 12.6 | -6.1% |
| 8 | Germany | 9.8 | 7.5 | 8.6 | 30.7% |
| 9 | South Africa | 9.5 | 10.8 | 11 | -12.5% |
| 10 | China | 9.3 | 11.6 | 13.1 | -20.0% |
| 11 | Russia | 6.5 | 6.3 | 5.4 | 3.0% |
| 12 | Portugal | 6.1 | 6.7 | 6.4 | -10.0% |
| 13 | Romania | 5.1 | 4.3 | 4 | 17.9% |
| 14 | Hungary | 3.6 | 3.2 | 2.8 | 14.6% |
| 15 | Brazil | 3.1 | 3.6 | 2.6 | -13.2% |
| 16 | New Zealand | 3 | 2.9 | 2.8 | 5.8% |
| 17 | Austria | 2.8 | 2.5 | 2.2 | 10.8% |
| 18 | Greece | 2.2 | 2.6 | 2.7 | -15.4% |
| 19 | Moldova | 1.9 | 1.8 | 1.8 | 5.5% |
| 20 | Switzerland | 1.1 | 0.8 | 0.9 | 40.4% |
| 21 | Bulgaria | 1 | 1.1 | 1.3 | -3.6% |
| Other countries | 15 | 14.5 | 14.8 | 3.4% | |
| World Total | 292.3 | 249.8 | 270.9 | 17.0% | |
| Source: OIV Note de conjoncture mondiale 2018 | |||||
World vineyard surface area
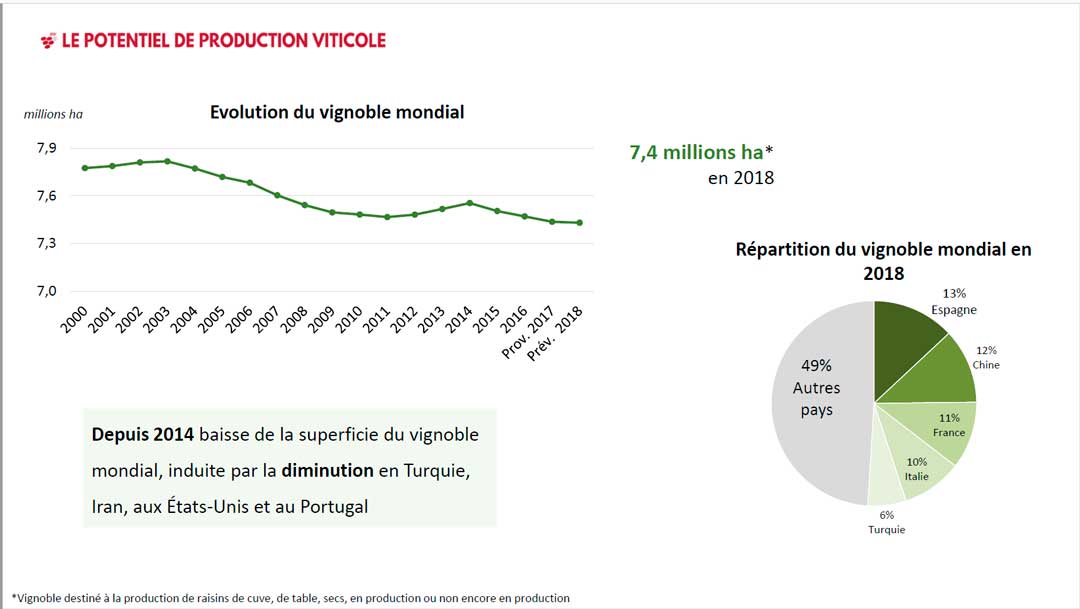
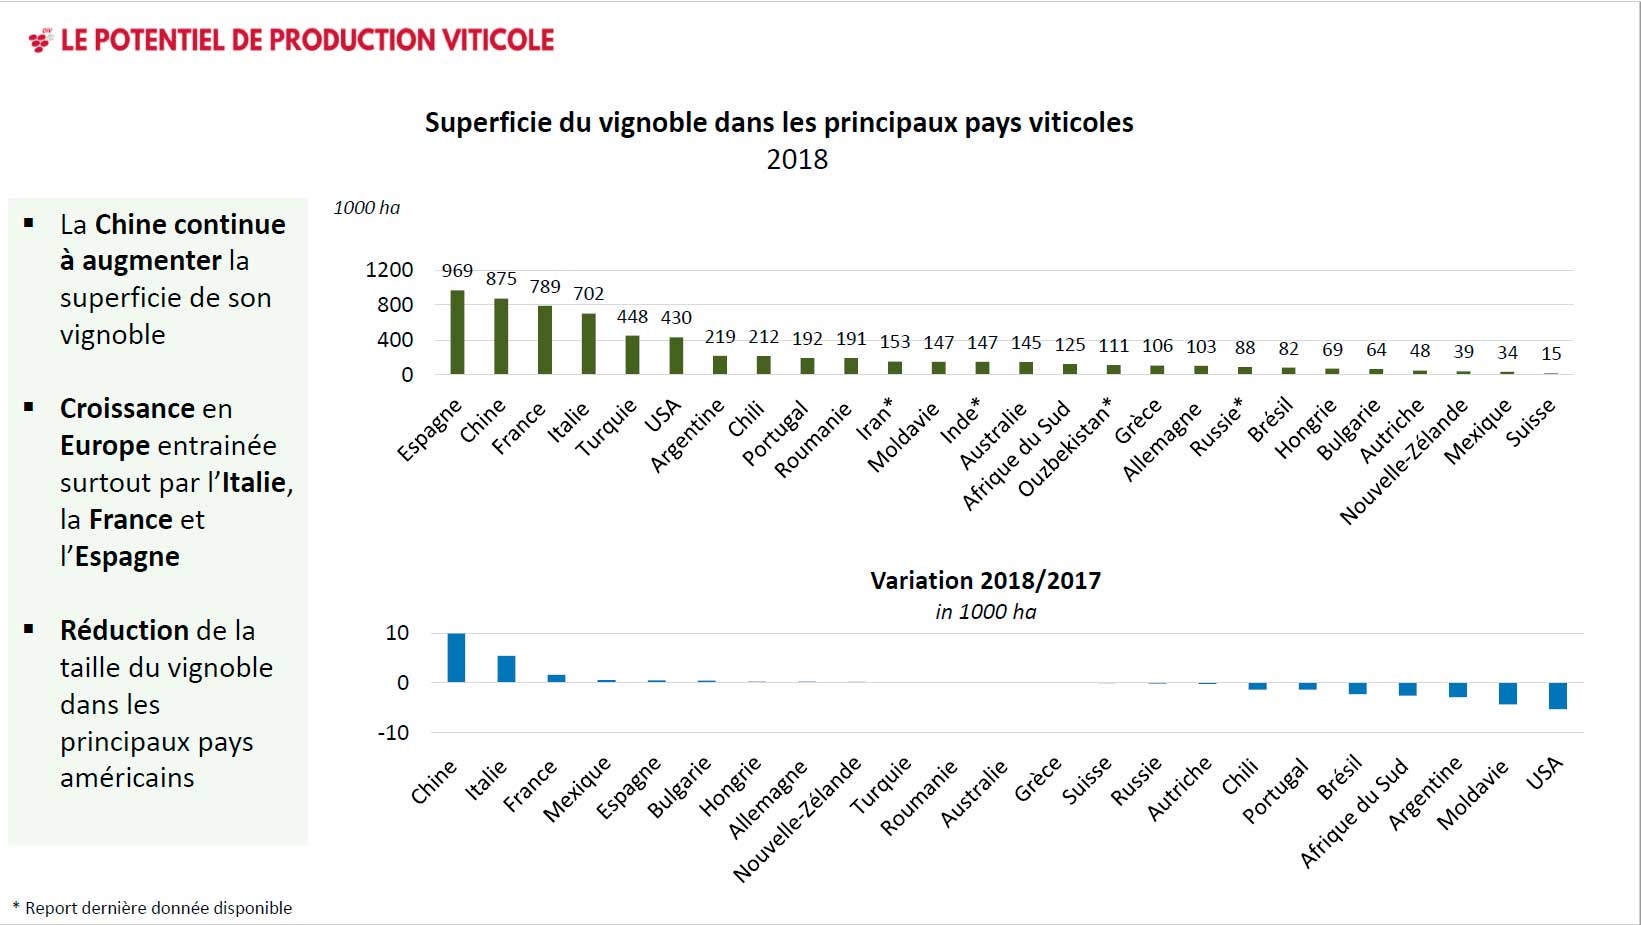
World vineyard surface area remains unchanged at 7.4 million hectares (M ha). There has been a steady decline in the acreage planted with vines since 2003 when it reached just over 7.8 M ha. Spain is the biggest country with 969 thousand hectares (k ha), followed by China (875 k ha), France (789 k ha) and Italy (702 k ha).
The most important drives of the global decline in vineyard acreage in recent years (so, not from 2017) have been the reduction of plantations in Turkey, Iran, USA and Portugal, according to the OIV.
It is important to note that these numbers concern the area planted with vines, producing grapes, but grapes that are used for any purpose. Most of the grapes are of course used for wine, but a significant portion is also used as table grapes, as grape juice, raisins, must etc. This is obvious when you look at some of the countries that are the major grape growers, as well as when you compare the top-ten vineyard surfaces to the top ten wine producers.
Most of Europe is stable, with a basically unchanged vineyard surface: Spain, France, Romania, Greece, Germany and Switzerland.
The odd man out in Europe is Italy that has increased its vineyard acreage with around 5,000 ha, reaching 706 M ha. The regulation within the EU limits new plantings (a legacy of the now abolished planting rights) to 1% new plantings every year. Most countries (including France and Spain) don’t use this allowance but Italy has been quite efficient in creating new vineyards. Without having any numbers to support it, I venture a guess that a big portion of this is in the prosecco appellation.
Two European countries have actually shrunk: Portugal decreased its surface with 1,300 ha (-0.7%) due to people (sadly) abandoning small vineyards or uprooting, and Moldova with 4,300 ha (-2.8%) due to a significant restructuring of its vineyards, according to the OIV.
For Europe, this is quite a change compared to previously. For a long time, the vineyard surface has shrunk, partially due to the old policies with vine-pull schemes (related to subsidies and to the planting rights system, no abolished). If the current stabilisation will remain in the longer term remains to be seen.
The EU has a total of 3.3 M ha, which is 45% of the world’s total. Europe thus has more productive vineyards, with higher average yields, than the rest of the world. Perhaps a surprising conclusion?
Outside of Europe there are two significant growth countries: China, that continues to grow and solidify its position as the world’s second biggest grape grower (but little made into wine), reaching 875 k ha (+1.2%), and Mexico that grew with 1.7% to an admittedly small 34 k ha (similar size as Champagne). Also, New Zealand continues to grow, up 0.6% to 39 k ha.
In many of the other New World countries, vineyards were significantly reduced. USA was down with 1.2% (to 430 k ha), Argentina -1.3% (219 k ha), Chile -0.6% (212 k ha), South Africa -2% (125 k ha), and Brazil -2.7% (82 k ha). The reason for this decline is not clear. It may have to do with these countries much greater flexibility (compared to Europe) in switching to alternative use of the land when markets are not so favourable.
See more on the historical vineyard surface area here.
| World vineyards surface, thousand hectares (k ha) | ||||
|---|---|---|---|---|
| 2018 | 2017 | Change '17-'18 | ||
| 1 | Spain | 969 | 968 | 0,1% |
| 2 | China | 875 | 865 | 1,2% |
| 3 | France | 789 | 788 | 0,2% |
| 4 | Italy | 702 | 696 | 0,8% |
| 5 | Turkey | 448 | 448 | 0,0% |
| 6 | USA | 430 | 435 | -1,2% |
| 7 | Argentina | 219 | 222 | -1,3% |
| 8 | Chile | 212 | 213 | -0,6% |
| 9 | Portugal | 192 | 194 | -0,7% |
| 10 | Romania | 191 | 191 | 0,0% |
| 11 | Iran* | 153 | 153 | 0,0% |
| 12 | Moldova | 147 | 151 | -2,8% |
| 13 | India* | 147 | 147 | 0,0% |
| 14 | Australia | 145 | 145 | 0,0% |
| 15 | South Africa | 125 | 128 | -2,0% |
| 16 | Uzbekistan* | 111 | 111 | 0,0% |
| 17 | Greece | 106 | 106 | 0,0% |
| 18 | Germany | 103 | 103 | 0,3% |
| 19 | Russia* | 88 | 88 | 0,0% |
| 20 | Brazil | 82 | 84 | -2,7% |
| 21 | Hungary | 69 | 68 | 0,5% |
| 22 | Bulgaria | 64 | 64 | 0,7% |
| 23 | Austria | 48 | 48 | -0,3% |
| 24 | New Zealand | 39 | 39 | 0,6% |
| 25 | Mexico | 34 | 34 | 1,7% |
| 26 | Switzerland | 15 | 15 | -0,3% |
| Other countries | 927 | 925 | 0,2% | |
| World | 7429 | 7428 | 0,0% | |
| Source: OIV Note de conjoncture mondiale 2018 | ||||
| *: last available year | ||||
World wine consumption
World wine consumption is stable and estimated at 246 million hectolitres. In the early 2000s, global wine consumption increased significantly and reached a peak in 2007-2008. Since 2009 consumption has been relatively stable.
It should be noted that “wine consumption” is in most cases difficult to know and numbers are approximate. For most countries, OIV makes estimates that can roughly be described as “production+import-export”.
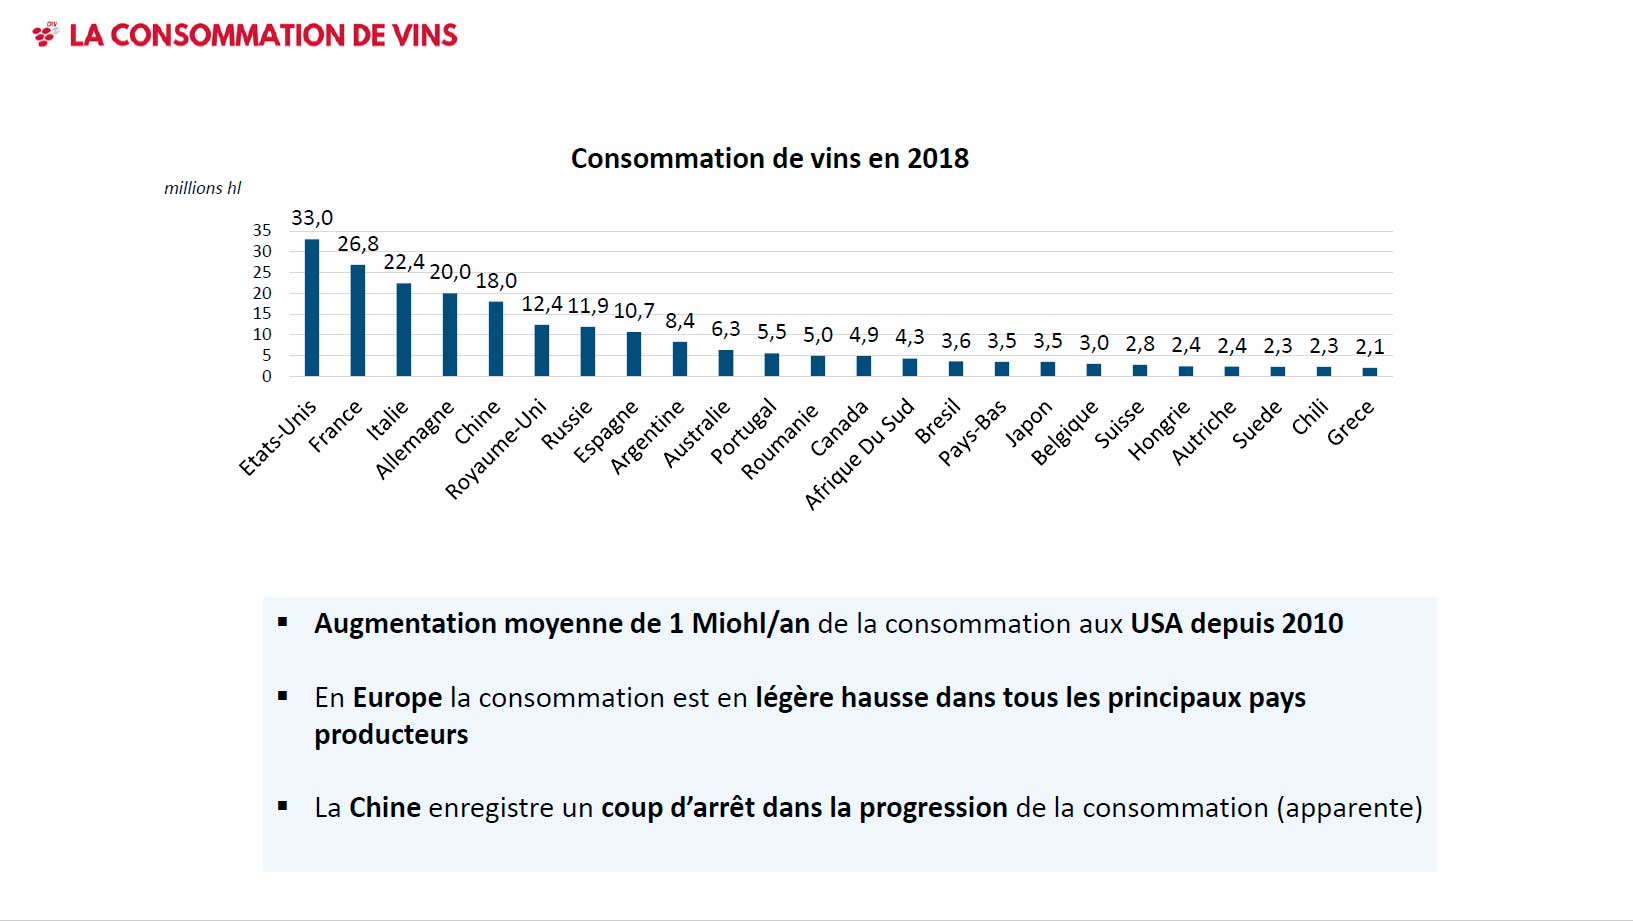
It is now for the 8th year in a row (since 2011) that the USA is the biggest market for wine, the country with the biggest wine consumption, 33 million hectolitres, even increasing with 1.1% on 2017.
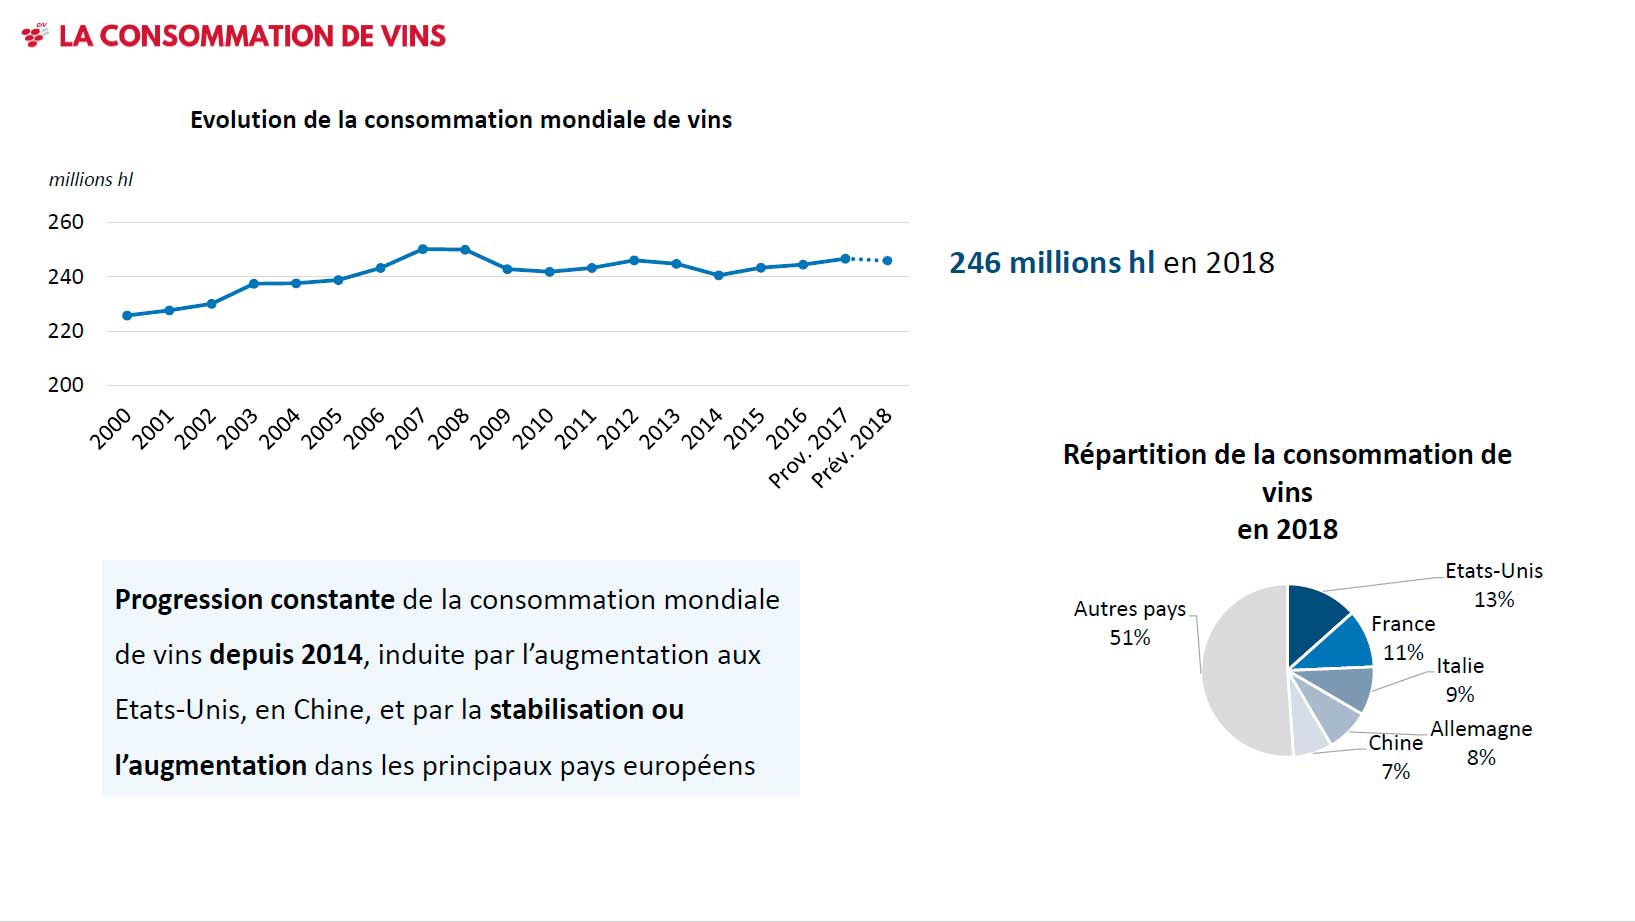
The following two names on the top list are, as expected, France (26 M hl, -0.7%) and Italy (22.4 M hl, -0.9%), followed by Germany (20 M hl, +1.3%).
The world’s 5th biggest wine consumer/market is China, which only reaches 18 M hl, a decline with -6.6%! Chinese wine consumption has increased dramatically since the beginning of the century, but not in 2018. If this is a blip or a change of the trend remains to be seen.
The five biggest consumers, USA, France, Italy, Germany and China, together represent half (!) of world consumption (49%).
Number 6 is also a market in decline, Great Britain (12.4 M hl, -2.6%)
Most other European countries show positive numbers, even the ones that have had a long-term decline: Russia (+6.9%), Spain (+1.8%), Portugal (+5.4%), Romania (+8.7%), Netherlands (a meagre +0.7%), Switzerland (+2.9%), and Hungary (+3.9%).
There are disappointing numbers in Sweden and Belgium, which are stagnant, and even worse in Austria (-2.6%) and Greece (-8.7%).
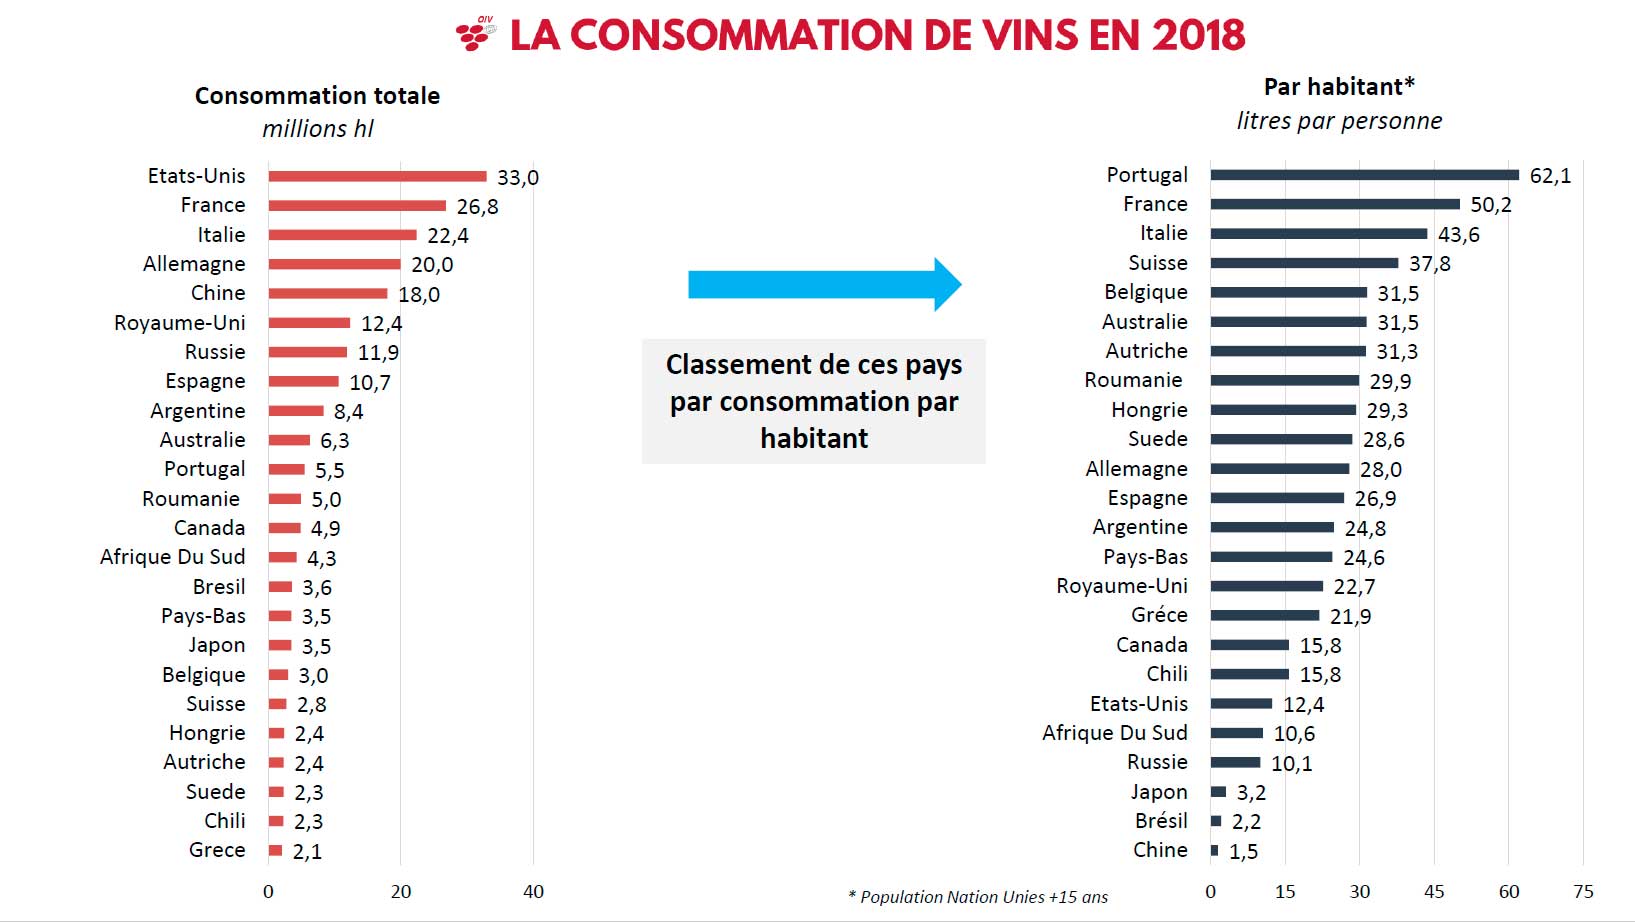
In some ways, a perhaps more interesting figure is the consumption per capita, which has also been calculated by the OIV. This is the top-list of consumption per capita (over age 15):
- Portugal, 62.1 litre
- France, 50.2 l
- Italy, 43.6 l
- Switzerland, 37.8 l
- Belgium, 31.5 l
- Australia, 31.5 l
- Romania, 29.9 l
- Hungary, 29.3 l
- Sweden, 28.6 l
- Germany, 28 l
- Spain, 26.9 l
- Argentina, 24.8 l
- Netherlands, 24.6
- Great Britain, 22.7 l
- Greece, 21.9 l
- Canada, 15.8 l
- Chile, 15.8 l
- USA, 12.4 l
- South Africa, 10.6 l
- Russia, 10.1 l
- Japan, 3.2 l
- Brazil, 2.2 l
- China, 1.5 l
Caution 1: As mentioned, the numbers are rough estimations.
Caution 2: The list is not exhaustive (complete) so it should not be taken as a literal top-list.
Read more on the historical evolution of global wine consumption here.
A note for Swedish readers: It is discouraging to note that wine consumption in Sweden is stagnant. It is also interesting to look at where Sweden ranks in terms of consumption per capita. We are not at the top, and it is not the case, as it is sometimes said that “in Sweden, we drink more wine per person than in France”. There’s still room for improvement.
Balance between production and consumption
There is a substantial gap between wine production (292 M hl) and wine consumption (246 M hl). There is 46 M hl more wine made than drunk. This does not mean that we have a new wine lake. In fact, this is a normal situation that is due to the fact that some of the wine that is produced is distilled to make spirits and some is turned into vinegar. A small portion of the difference can also be due to increased stock levels, although there is no statistics on that.
World wine trade
International trade in wine has almost seen an explosion since the early 2000s.
The value of exports has grown from 13.4 billion euro in 2000 to 31.3 billion euro in 2018, an increase of 134%, more than double. Comparing with 2017, the value of exports in 2018 was up +1.2%
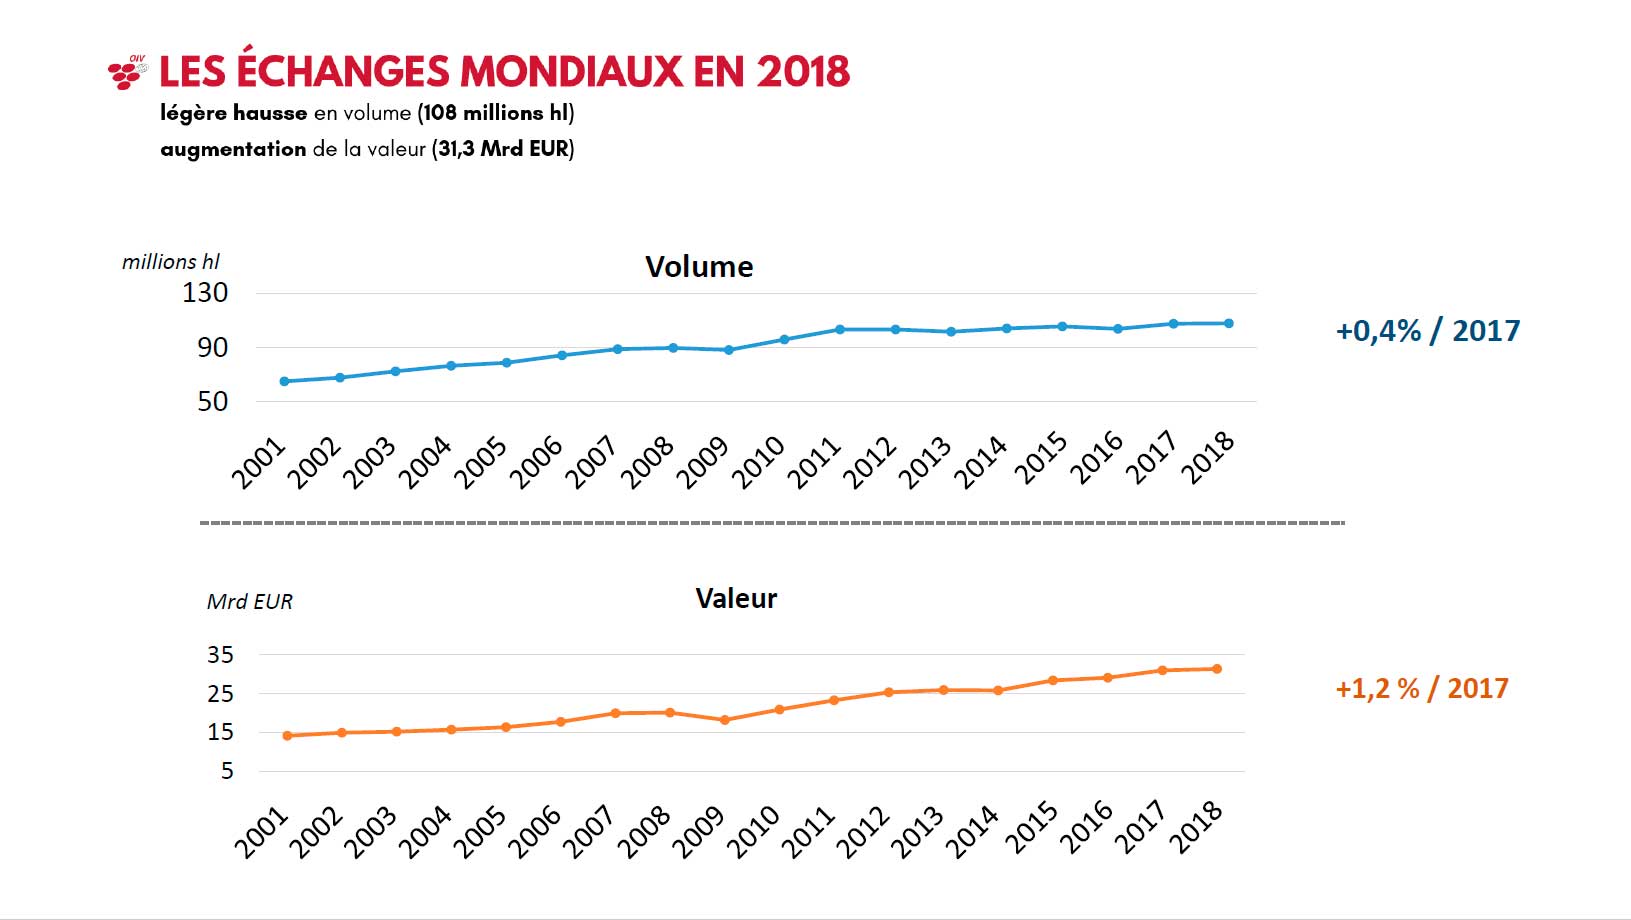
Volumes have seen an equally positive evolution. From 61 M hl exported in 2000, the world exports in 2018 reached 108 M hl, and increase with 77%, almost double. From 2017 the exported volume increases slightly, with +0.4%.
So the world is not only trading more and more wine but it is also exporting (and importing) more expensive wines.
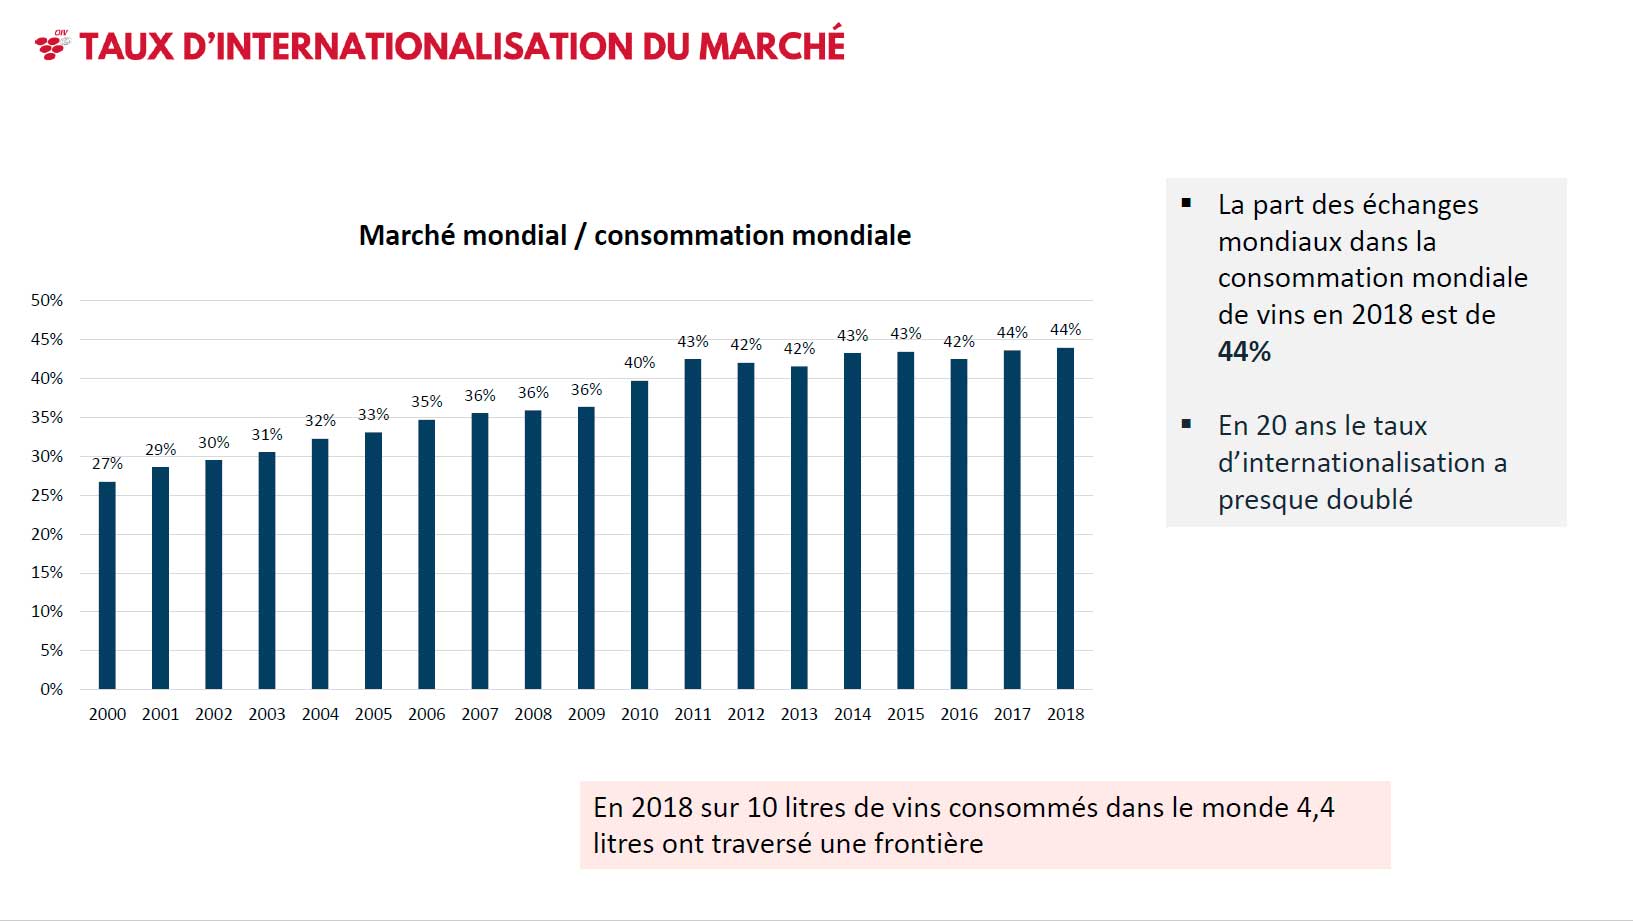
The world of wine has rapidly become much, much more international. Even if that tendency has slightly flattened in recent years (although still going up) it is clear that it is more and more important for wine producers to try and sell their wines abroad.
The biggest wine exporters, in volume:
- Spain
- Italy
- France
- Chile
- Australia
- South Africa
- Germany
- USA
- Portugal
- Argentina
The biggest wine exporters in value:
- France
- Italy
- Spain
- Australia
- Chile
- USA
- Germany
- New Zealand
- Portugal
- Argentina
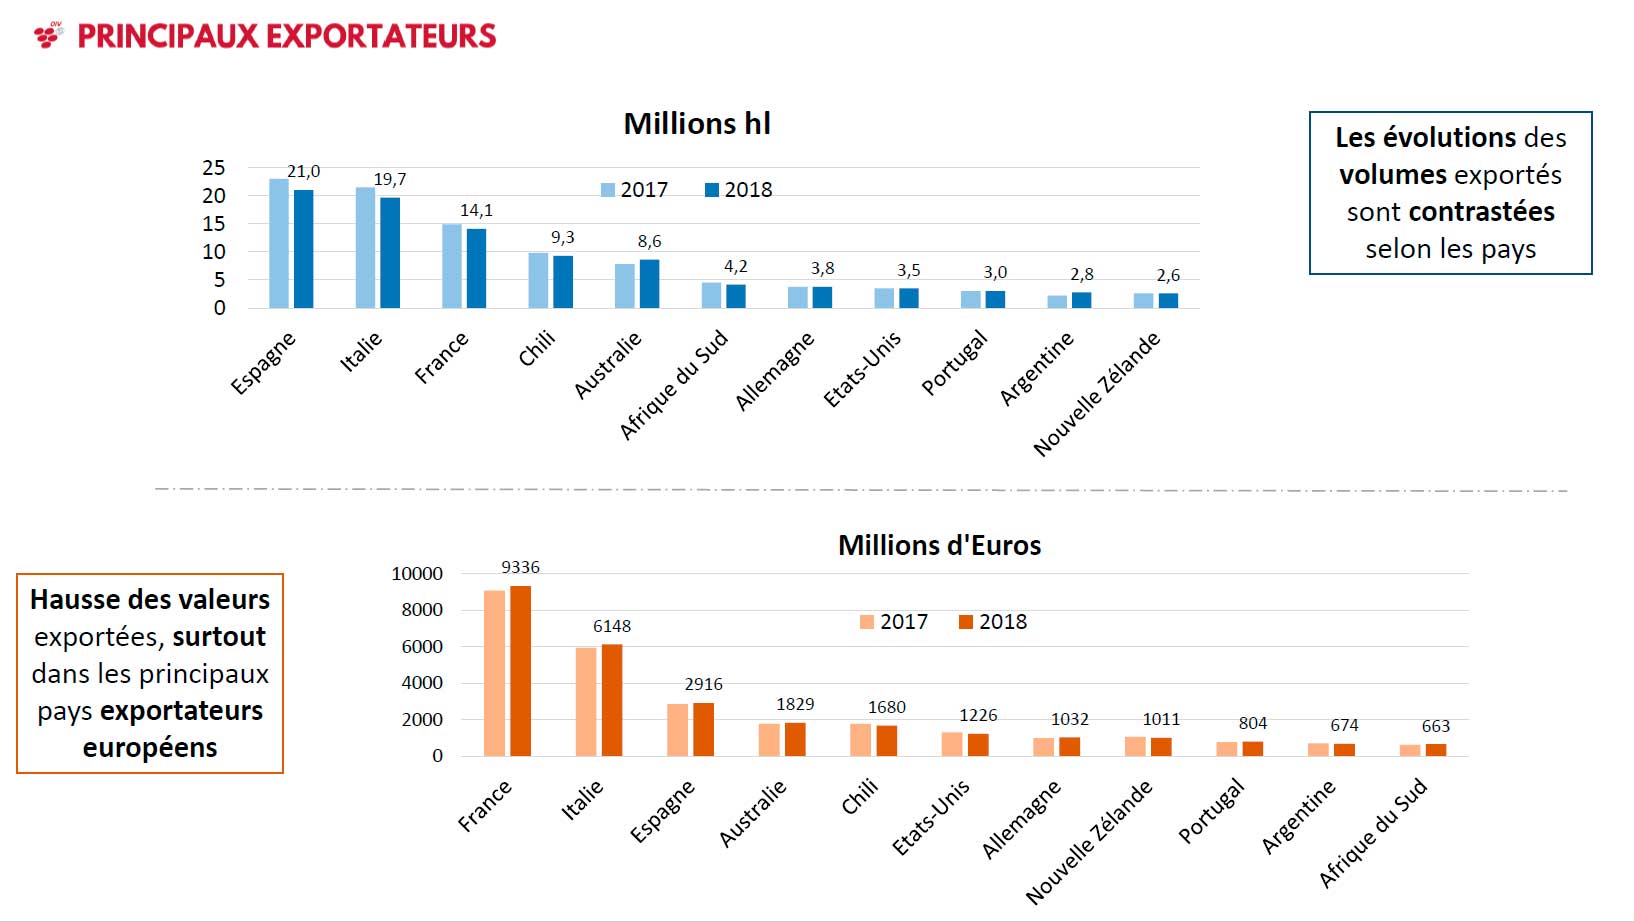
France gets a big boost in value from its expensive champagnes, half of which is exported (some 150 million bottles roughly), with a very high average price. Spain exports a lot of low-cost bulk wine, much of it to France. American wines are expensive, the highest average per-bottle export prices for still wines. New Zealand wines are also expensive, the second highest average for still wines. But the total value for both the USA and New Zealand has declined in 2018 (-6.2% and -4.6% respectively).
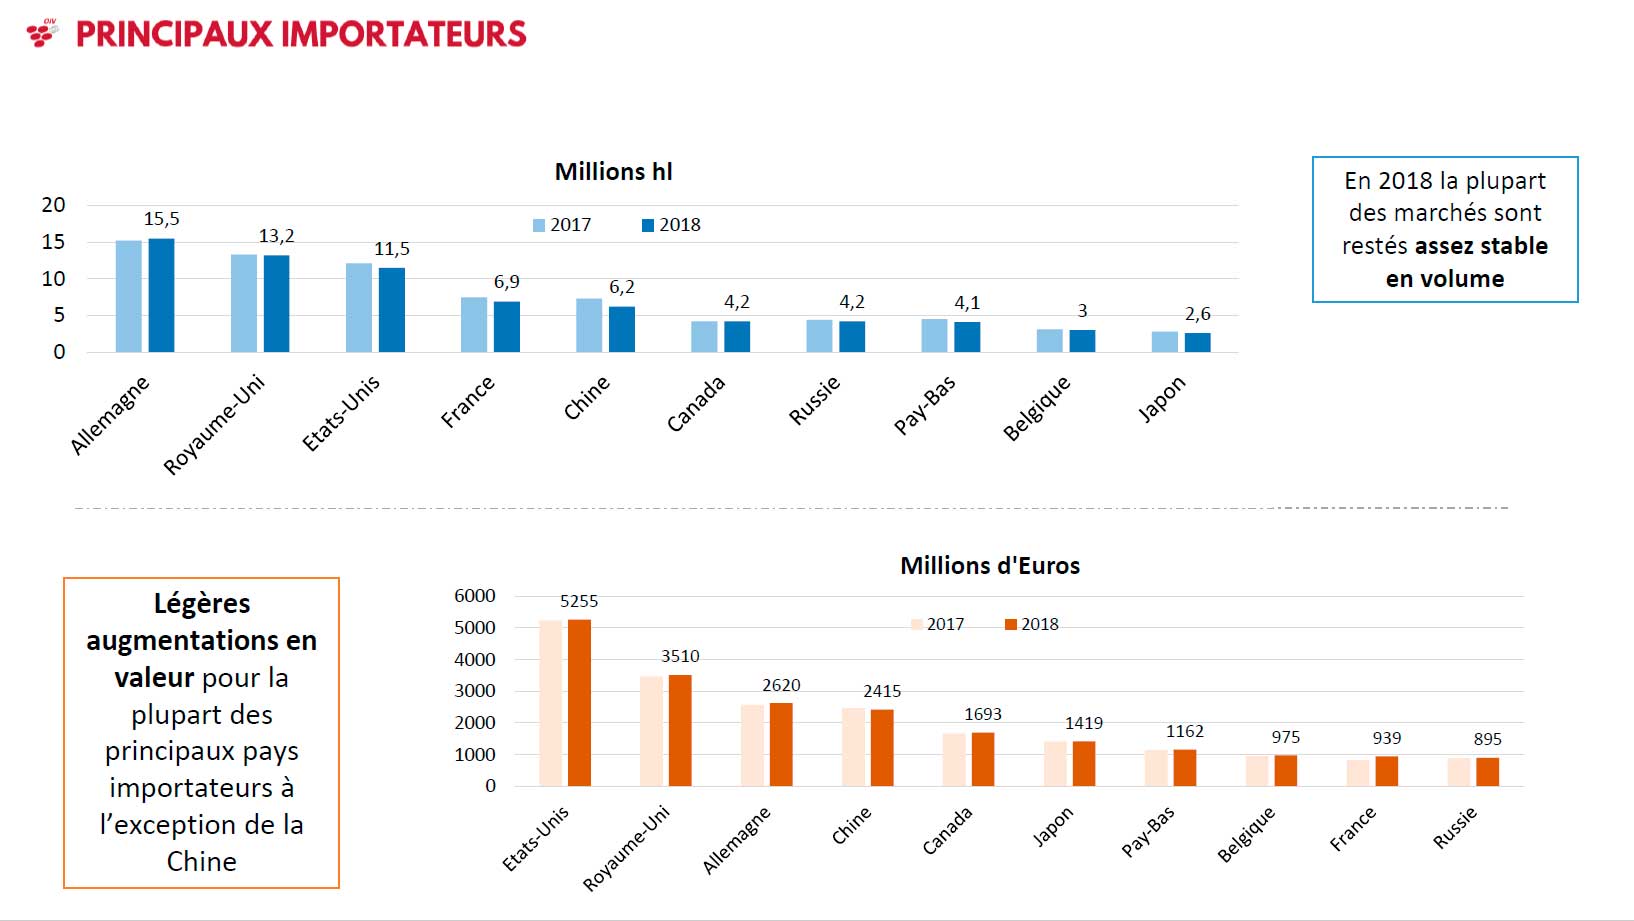
The biggest wine importers by volume 2018:
- Germany
- Great Britain
- USA
- France
- China
- Canada
- Russia
- Netherlands
- Belgium
- Japan
The biggest wine importers by value 2018:
- USA
- Great Britain
- Germany
- China
- Canada
- Japan
- Netherlands
- Belgium
- France
- Russia
German imports obviously focus on low-cost wines. It is a well-known fact that the German market is (sadly) focussed on “budget” wines. The French imports are even more concentrated on low-cost wines, which is probably because a big portion of it is bulk wine from Spain. The USA tends to buy expensive wines, as do the Japanese.
As opposed to what many people think, China is not mainly buying very expensive wines. Instead, their average import price is quite – average, in an international comparison.
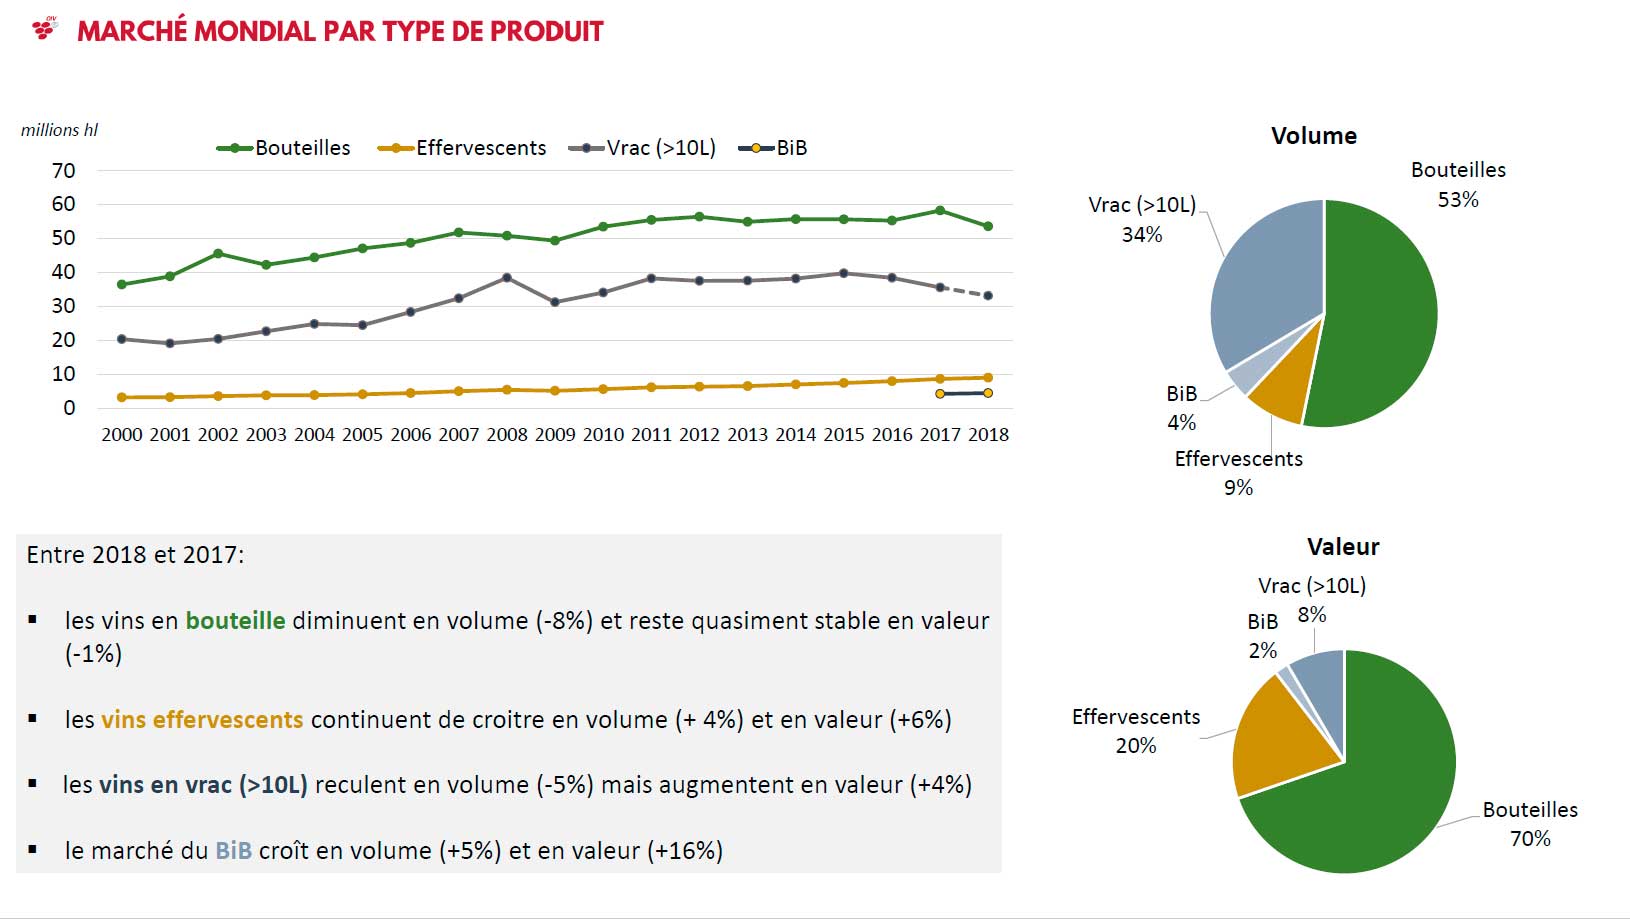
Packaging types
The dominant packaging for wines on export is still the bottle. Counted in value 70% of all exports are in bottle. Counted in volume it is 53%. However, in 2018 the export volume for bottles fell by 8%.
A quick look at the numbers may give the impression that bulk exports have fallen dramatically too. Yes, it has decreased compared to 2017. But the sharp drop since 2016 is to some extent explained that before that date “bag-in-box” was counted as bulk. From 2016 BiB has its own category, for any packaging over 2 litres up to 10 litres. Bib is now 4% of all exports.
That (low) number is maybe surprising for people in the Scandinavian markets where bag-in-box, often called “box wine” accounts for 50% or more of total wine sales (!), all of which is, of course, imported (although some is imported in “real” bulk and boxed locally).
Sparkling wine now almost accounts for one tenth of all international wine trade, in volume. 9% of international trade in wine was sparkling, following a steady rise since the early 2000s. Even more remarkable is that for Italy, the world’s biggest wine producer, sparkling wine accounts for 20% of exports (volume). This is to a large extent no doubt the prosecco effect. For France, the world’s second largest producer, sparkling wine accounts for 13% of exports. Counted in value, that number will be much, much higher, considering the high export prices of champagne.
Sparkling wine accounts for an astonishing 20% of all exports, when counted in value (again, to some extent the champagne effect).
A note on China
The very rapid growth of Chinese wine production and Chinese wine consumption did not continue in 2018. Since so many wine producers and wine regions pay a lot of attention to the Chinese market, and on China as a competitor, it is worth having a closer look.
Chinese wine production fell by 20% (!) in 2018. It is now only the tenth biggest wine producer. China is marginally behind South Africa and chased by Russia.
Chinese wine consumption fell too, with -6.6%. But still, China is now the world’s fifth biggest wine consumer.
And China is still solidly the country with the world’s second biggest vineyard surface area.
However, it is difficult to draw any clear conclusions since the numbers for China are 1) volatile, and 2) very approximate. Chinese (wine) statistics are not yet very reliable.
One thing is clear though, the reputation of China as a country that only buys the most expensive, famous, exclusive wines is not correct. It is a big market for very “normal” wines too. But not an easy one.
A few conclusions or comments
A few conclusions or comments, that are mine, and not from the OIV.
- Overall the wine sector is in reasonable health. Wine production is growing or is stable.
- The very rapid decline of European wine production, relative to “New World” wine production may have stopped. The decline was to a large portion due to antiquated regulations as well as a lack of focus on what consumers want. Both of those things seem to be changing in Europe, albeit very slowly.
- Europe is still by far the dominant player in wine, and when we say Europe, we primarily mean France, Italy and Spain.
- There are no recent dramatic changes in vineyard surface area.
- World wine consumption is healthy. It is even growing in some of the traditional big wine producing countries where consumption has been steadily declining previously. But it is probably too early to hope for an end to that decline.
- The global wine scene is getting more and more international. We will soon reach the day when more than 50% of all wine crosses an international border before being consumed. Selling to other countries is an essential fact of life for many wine producers today.
- But not all export markets are equal.
Do you have any other conclusions or comments? Write a comment below!
You can find the original documentation from the OIV here.


7 Responses