
How much output you get from a certain input is what we usually call productivity. In the wine industry we usually talk about yields, often in hectolitres per hectare. This article explores the productivity/yields in the wine industry in 2020. Which are the countries that have the highest yields, i.e. gets the most grapes – and thus wine – per vineyard acreage? We get some surprising answers. And we also get a good illustration of that high yields are not necessarily a sign of simple wine. We also explore some of the factors that have an influence on the yields. Join us in this fun number-crunching exercise.
Read all our articles in the Wine Global 2020 series here:
- Global wine production 2020
- The World’s vineyard surface 2020
- How important is wine production to a country?
- The world’s most productive wine producing countries
- World wine consumption in 2020
- Wine consumption per person in 2020
- World wine exports in 2020
- World wine imports in 2020
- Wine exports compared to total production (dependency on exports)
- Wine exports compared to GDP and to total exports
- Average price per litre on export, by country
- Exports in bottle, sparkling, bag-in-box, bulk in 2020
This is a longer version of an article published on Forbes.com.
This is our own back-of-the-envelope calculation based on the figures from the OIV (International Organisation of Vine and Wine). Many factors are influence these numbers, and doing rough estimates as we do here will only give you a very approximate picture. But it’s still an interesting view.
The two concepts, productivity and yield, are more or less the same measure, but the different wordings shine different lights on the issue. High productivity would normally be considered good, but high yields are often considered bad (in conventional wine wisdom), but the two can be seen as the same thing.
As noted above (see comment on European wine production in the previous article), high volumes do not necessarily mean low quality. 2020 was a year when many regions in Europe made (or could have made, if restrictions had not been put in place, see comment on this in the article on wine production) large volumes of very good quality.
A further complication is the definition of the concepts.
“Yield” is relatively unambiguous. It is hectolitres per hectare (in some cases expressed in other units: quintals per hectare, tonnes per acre etc.).
“Productivity”, on the other hand, can be interpreted in different ways. The OECD says, “Productivity is commonly defined as a ratio between the output volume and the volume of inputs”, and with hectares as the volume of input, this is then yield. An alternative way is to look at the value of input and output. Yet another possible definition is to measure net sales compared to employees’ number of hours worked. But all this becomes too complex to work with in our case, so I will limit myself to the yield definition.


The dotted red line in the charts indicate the world average of 47 hl/ha.
The below table is thus a very rough estimate of average yields (or productivity) in most of the principal wine-producing countries. For China, Greece, USA and World, I have used the estimates of the wine-producing vineyard acreage that I did in the article on vineyard acreage. Keep in mind that also for some of the other countries, a portion of the grapes may be used for other products than wine. But I don’t think the numbers are very far off.
Average yields in most of the main wine-producing countries, hectolitre per hectare (hl/ha)
| Rank Yield | Country | Rank volume | Mhl ’20 | kha ’20 | Yield: hl/ha | Diff. compared to world average |
|---|---|---|---|---|---|---|
| 1 | South Africa | 7 | 10.4 | 122 | 85 | 80% |
| 2 | New Zealand | 14 | 3.3 | 40 | 83 | 75% |
| 3 | Germany | 9 | 8.4 | 103 | 82 | 73% |
| 4 | USA # $ | 4 | 22.8 | 305 | 75 | 58% |
| 5 | Australia | 6 | 10.6 | 146 | 73 | 54% |
| 6 | Italy | 1 | 49.1 | 719 | 68 | 44% |
| 7 | France | 2 | 46.6 | 797 | 58 | 24% |
| 8 | Argentina | 5 | 10.8 | 215 | 50 | 6% |
| 9 | Austria | 16 | 2.4 | 48 | 50 | 6% |
| 10 | Chile | 8 | 10.3 | 207 | 50 | 5% |
| 11 | Russia | 12 | 4.4 | 96 | 46 | -3% |
| 12 | Spain | 3 | 40.7 | 961 | 42 | -10% |
| 13 | Greece $ | 17 | 2.3 | 59 | 39 | -18% |
| 14 | Hungary | 15 | 2.4 | 65 | 37 | -22% |
| 15 | Georgia | 19 | 1.8 | 49 | 37 | -22% |
| 16 | China # $ | 10 | 6.6 | 190 | 35 | -27% |
| 17 | Portugal | 11 | 6.4 | 194 | 33 | -30% |
| 18 | Brazil | 18 | 1.9 | 80 | 24 | -50% |
| 19 | Romania | 13 | 3.6 | 190 | 19 | -60% |
| 99 | World total $ | 99 | 260 | 5500 | 47 | 0% |
Estimation made by BKWine based on OIV data.
# – indicates estimate by OIV
$ – indicates that “vineyards for other use than wine” have been extracted from the acreage based on BKWine estimate (See the article on vineyard surface area.)
Note: you can sort the table on the different columns
Please note that this table only includes the bigger countries, the top 19 in production volume.
What affects vineyard yields?
What yields you get (or can get) depends on numerous factors. Here are some:
- Climate: no doubt one of the most important aspects. In hot and dry climates, yields are often very low.
- Water: the rainfall you get and/or access to irrigation. Plentiful water can be a contributor to larger yields. However, it is a mistake to think that using irrigation in a vineyard automatically means that the quality is lower. There are many irrigated vineyards around the world that produce outstanding quality
- Sparkling wine: Sparkling wine is typically produced from higher yields
- White or red wine: When making white wine, you can typically get quality wine from higher yields.
- Bulk: Bulk wine production is often from high-yielding vineyards. There are exceptions though, see, for instance, Spain.
- Topography: it is easier to get high yields on flatland than on steep slopes
- Regulations: Regulations in different appellations often restrict yields
- Grape variety and rootstock: yields can vary greatly, even depending on chosen rootstock. Also, the health and age of the vineyards can have a significant impact
- Soil
- Pruning: pruning and training of the vine is probably the wine grower’s most important tool to control yields. It has a direct impact on fruit quantity.
- Vineyard management: e.g. how the soil is managed (ploughed, tilled, cover-crops,…), if fertilisation is used etc
- Etcetera
Some comments and conclusions that, to a large extent, are simple hypotheses and that would need further research to be verified:
High yielding countries:
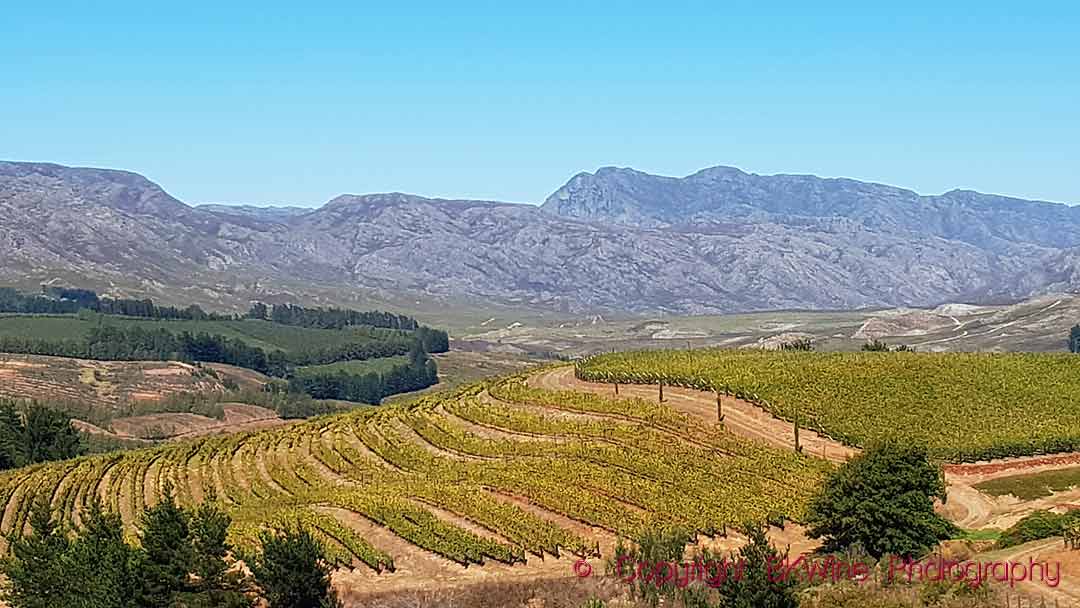
South Africa:
- 85 hl/ha, at the top in the yield ranking, with yields at 80% above the world average.
- A bit of a surprise. When you travel in South Africa, you don’t get this impression. Vineyards generally look as if they would give normal to low yields compared to vineyards in Europe. But apparently, there are still large areas giving very high yields. It is certainly a grave mistake to take this number as an indication of the quality of South African wines.
- This may have to do with that there is a significant brandy production, which often uses high-yielding grapes, although this has been much reduced in recent years.
- Another factor can be that there is a significant bulk wine production and that a large part of the production is white.
- The real number may be even higher since WOSA estimates that only 92,000 ha are used for wine. But we have not taken that into account here; we use the OIV number.
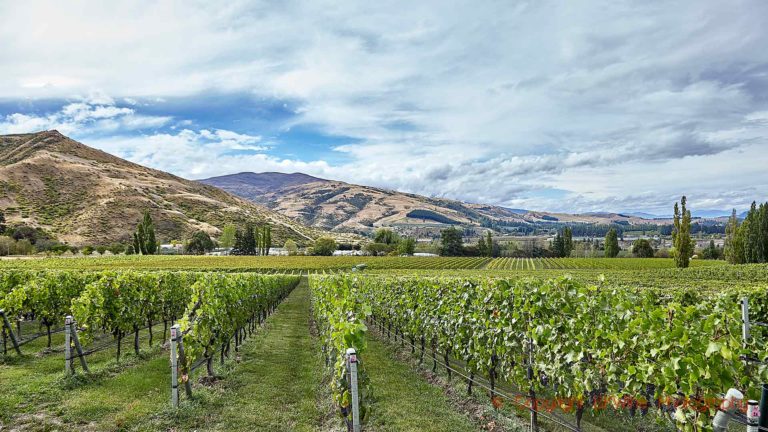
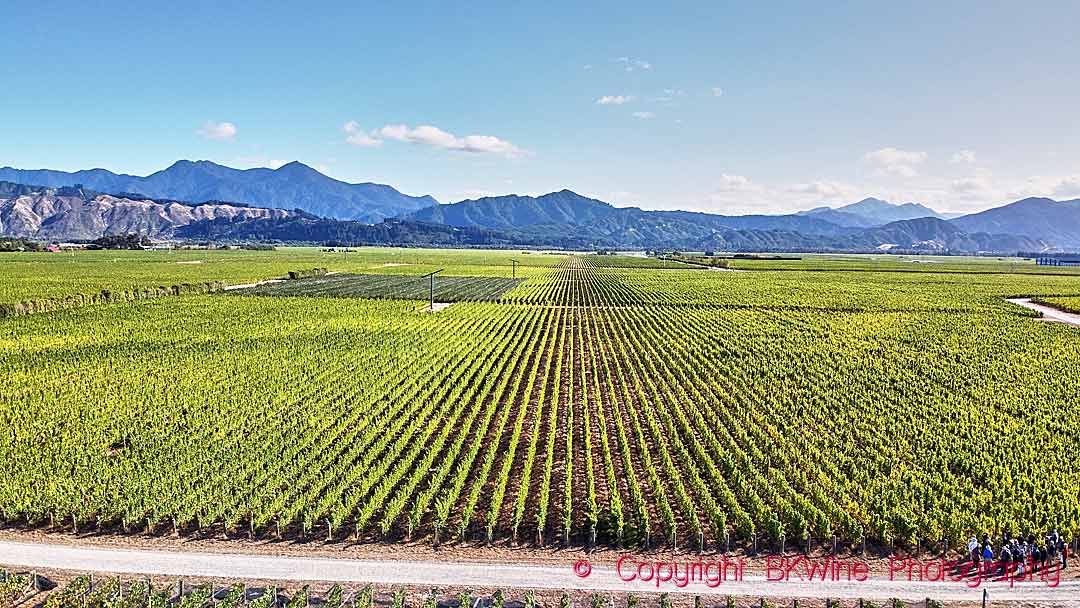
New Zealand:
- 83 hl/ha, 75% above the world average, the second-highest yielding country
- A very large portion of the New Zealand wine production is sauvignon blanc (around 70%), mainly from Marlborough. These vineyards are typically very high yielding.
- But even so, the position is quite surprising, given the reputation of New Zealand of producing mainly high-quality wine and not so much bulk (which they nevertheless actually do make quite a lot of).
Germany:
- 82 hl/ha, 73% above average. The third highest yield country
- Well-known to be a country with high yields. It is dominated by white wine, which supports high yields better.
- They also have a significant sparkling wine production (about a quarter of the total) that is often based on high-yielding vineyards.
This is perhaps a good illustration that white wine production can sustain higher yields than red wine production. Red wines depend to a large extent on extracting phenols (tannins, colour and others) from the grape skin. White wine does not. Higher yields can be achieved by harvesting bigger grapes with a lesser ratio between skin and juice. But not all high yields are due to big grapes; it is, of course, also the quantity of grapes that is important. Yields tend to be high in white wine regions and in sparkling wine-producing regions. These wines are more dependent on the acidity in the grape, which is less (or not at all) affected by the yield.
USA:
- 75 hl/ha, 58% above average
- Even if the US is famous for rare and expensive wines from some of its regions, there is no doubt that there are large areas of intensive grape production for mass-produced wine. Consider, for example, that it is home to Gallo, the world’s largest wine producer.
- In the coming years, this may change as the availability of water for irrigation is becoming an issue. If in the future, vineyards are less irrigated, yields may decrease.
Australia:
- 73 hl/ha, 54% above average
- It has for a long time been a country where parts of the industry is an industrial type of wine production for bulk wine.
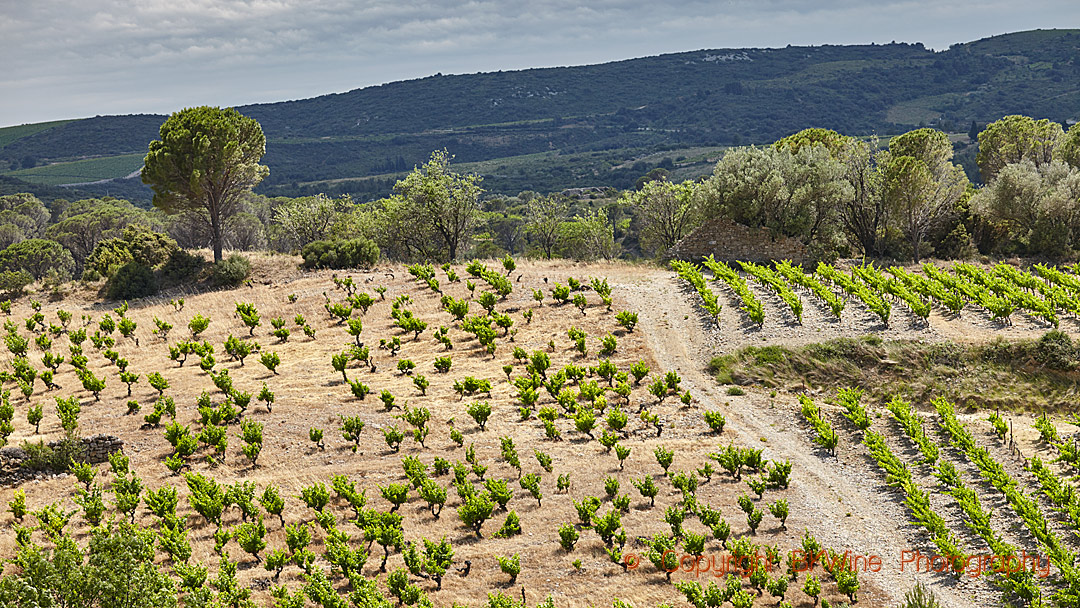
Italy, France:
- Italy: 68 hl/ha, 44% above average
- France: 58 hl/ha and 24% above average
- Both countries do have a significant bulk and entry-level production (usually based on high yields). Both countries also have in general modern and intensive production.
- There are three obvious factors that may contribute to the high number for Italy: the very high yields and the very large volumes of prosecco; the equally highly exploited pinot grigio; and the considerable amount of bulk wine.
- It is a bit surprising, though, that the average yield in France is not more than 58 hl/ha. However, it has a lesser portion of bulk wine than in Italy. The two regions with very high yields, Champagne and Alsace, are fairly small. And also, the very extensive vineyards in the hot and dry south of France making IGP and other simpler wines are as yet not much irrigated (only some 14% are irrigated). Even though large volumes come from here, yields are not always that high.
Low yield countries
Romania, Brazil, Georgia, Hungary, Greece:
- 19-39 hl/ha
- Several of the low-yield countries are countries that have a poorly developed (modernised) wine sector with old-style vineyards (e.g. in the ex-Soviet Union) and/or are in climates that naturally restrict yields (notably Greece).
- In some cases, a significant amount of the grapes is probably used for unregistered home winemaking (Romania, Georgia), which doesn’t show in the wine production statistics.
Portugal:
- 33 hl/ha, 30% below average
- This is probably a reflection of that the wine industry in many parts of Portugal has not yet quite caught up with the modern era in viticulture and vinification. Mechanisation is less advanced than in some other countries.
- There is comparatively little bulk wine production (see the future article on wine exports). 80% of the wine is put in bottle.
- They also have a challenging, hot and dry climate, not least in the very large Alentejo region.
China:
- 35 hl/ha, 27% below average
- A bit of a surprise, or maybe not. When you travel in China and visit vineyards, almost all – actually really all – wineries are impressive, modern, latest technology and often big. So one would think that it would be a country with high productivity/yields. But when you then go for a walk in the vineyards, you can see that the viticultural level is often not as high as the technological one in the cellars.
- China also has a very challenging climate for wine growing in many places, with too much humidity or too cold winters or too little water etc. (One should also keep in mind that statistics from China are very unreliable.)
Spain:
- 42 hl/ha, slightly below average (-10%)
- Spain is a hot and dry country and also very mountainous, three factors pushing yields down.
- I don’t have the historical figures, but I would guess that the yields have moved up substantially both because irrigation is now more widely used and more modern technology is used.
- And maybe the recent decline in acreage is mainly in low-yielding areas or vineyards that have had a mixed-use (and thus low productivity).
- Yields will probably move up since they do have a significant bulk production, and vineyards and vineyard management are being modernised.
Average yield countries
Argentina and Chile:
- Both are almost exactly at world average yields, 50 hl/ha, +6% and +5% (rounding difference) respectively, compared to the world average
- It is perhaps surprising to see Argentina and Chile at lower yields than France and Italy since the two South American countries are often – in the minds of many people – associated with bulk wine (which is correct). Today they do make excellent high-quality wines.
- The main factor that keeps down the yields are, however, most likely the hot and dry climate.
- And some areas are not very technologically advanced.
Update:
A Chilean viticulturist has kindly pointed out that the Chilean vineyard surface area actually has a large portion dedicated to table grapes, and a not insignificant number for pisco production. The official numbers for 2020 are, according to our source:
- Wine grapes: 136,289 hectares
- Table grapes: 47,834 ha
- Pisco production: 9,173 ha
- Total: 193,296
The total wine production was, according to the same source: 10,337,222.88 hectolitres (that is 1,033,722,288 litres!).
Using these numbers, the average yield in Chile is 76 hl/ha.
The reason for the difference is a) that my original calculation was based on the “preliminary” numbers from the OIV, and b) grapes used for other purposes than wine was not extracted from the calculation (this number can sometimes be hard to find, although for most countries it is negligible).
Other countries would probably also show some differences compared to my original calculation if one reworked the numbers in a similar way.
As mentioned initially, these kinds of “back of the envelope” calculations have a high uncertainty, but can still be useful. And fun.

Austria:
- 50 hl/ha, +6% compared to the world average
- Considering that there are many similarities between Austria and Germany, this low figure (compared to Germany) is a surprise.
- Possibly it is due to that there is very little “entry-level” wine, Austria having over several decades pushed for quality production and they make very little sparkling.
Russia:
- 46 hl/ha, also very close to the world average, -3% compared to average
- I don’t have enough knowledge about wine production in Russia to have any comment. But judging from the status in the other countries I know in the old Eastern Block I would assume that both vineyards and winery technology in many cases are old and with low productivity.
As I mentioned, this is a very rough calculation and some personal hypotheses. But it does illustrate some interesting aspects of the wine business.
Please comment below!