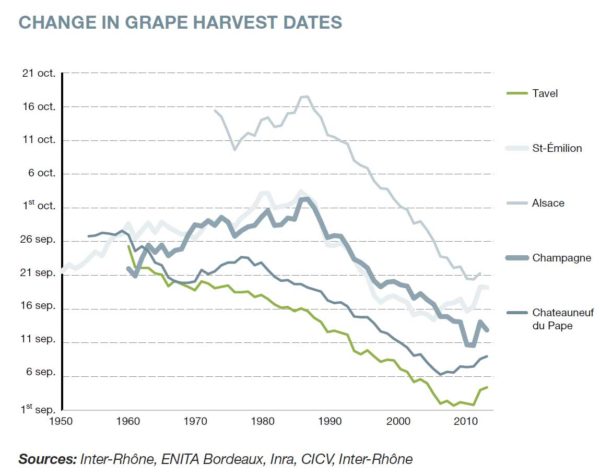

It is much debated (albeit less and less) whether global warming is a real phenomenon or not. I saw an interesting illustration of how the harvest dates have evolved in different wine regions in France since 1950. The figure came from Institute for Climate Economics (I4CE) and is taken from a report entitled Key Figures on Climate, France and Worldwide.
The most dramatic example is Alsace: in 1970 (the earliest date noted for Alsace) they harvested starting on October 16 and in 2010 it started on September 21. Between those years it was a steady change to earlier dates. Tavel, St Emilion, Champagne and Chateauneuf-du-Pape are also on the chart.
For sure one can question these numbers. Why is not a longer date series given? How do you take into account other factors that affect the harvest date? What about other wine regions? Etcetera.
But it is at least an interesting graph!
UPDATE: You can find a much longer article on the subject with more data from different countries here on The Wine Gourd: Grape harvest dates and the evidence for global warming.