
Global wine exports and wine imports
The world trade in wine has gone up since 2000 although it went down slightly in 2012. But in real terms (inflation corrected) it seems that the value of the wine has gone down. Winemakers get less money today than in 2000. France is the biggest exporter in value and Italy in volume. The UK and the US are the biggest importers.
The picture of the global wine trade (international trade in wine) is a bit more complex than the trends in vineyard area, grape production, wine production and wine consumption. So what I will do is pick some of the interesting items of the OIV presentation worth commenting on.
Trade is growing but value may be falling
The global world trade in wine has seen a steady rise since 2000 with the exception of 2008 and 2009. Let’s look at both the value and the volume
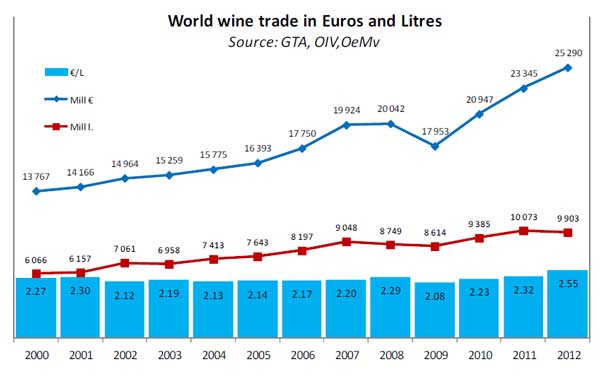
Measured in value global trade in wine has increased from 13.8 billion euro in 2000 to 25.3 bn euro in 2012, an 84% increase. This is an annual increase in value of 5.2%.
Measured in volume the increase has been slower. In 2012 we even saw a decrease in the world trade in wine from 10,073 Mhl in 2011 to 9903 in 2012, or -1.7%. My guess would be that the slight drop in 2012 is not the beginning of a slowdown or downward trend. It seems more likely that it simply is the result of the exceptionally low quantity of wine produced in 2012. Having written that made me think again. The very small harvest in 2012 could hardly have had a substantial impact of the trade in the same year, so it probably has another explanation.
Over the period 2000-2012 the volume has grown from 60.1 million hectolitres to 99 Mhl in 2012, an increase with 63%. This is an annual growth in volume of wine traded over the period of 4.2%.
One conclusion is obvious: the unit value of wine has gone up: from 2.27 euro per litre in 2000 to 2.55 euro/l in 2012, an increase with 12.3% over the full period.
This is equal to an annual increase in the price per litre of wine of only 1%. To know exactly how to interpret this one would have to look at the details, which country exported how much and what was the inflation rate. But it seems likely that the conclusion would be that the inflation-corrected unit value of wine traded has gone down. Wine producers get less money per litre in real terms for their wine today than they did in 2000!
In graphic form:
Trade in “bulk” wine is growing but perhaps the OIV needs to change its definition
The OIV statistics split up the world wine trade in must, bulk, bottled wine and sparkling wine. But it is difficult to know how to interpret these numbers.
Since 2000 the trade in bottled wine has shrunk from 60% of all internationally traded wine to 55%. At the same time trade in bulk wine has risen from 34% to 38%. Slow but steady changes. This is in volume.
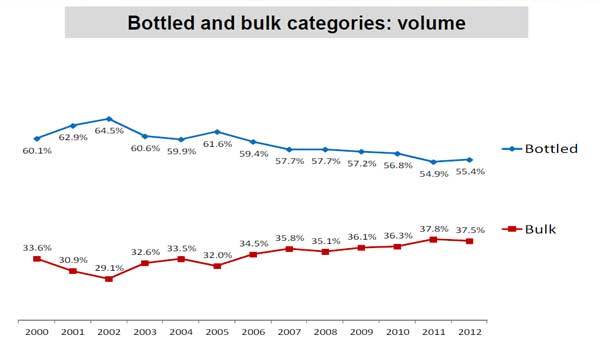
It is questionable how useful these numbers are since the OIV counts as “bulk” anything that is shipped in containers bigger than 2 litres. This means that the majority of bag-in-box wines is counted as “bulk”. I do not have any numbers of the evolution of bag-in-box trade but my guess is that it has increased significantly. This makes the OIV split in bulk vs bottle possibly meaningless.
A more sensible definition of “bulk” would be wine that is not shipped in a container destined for the end-consumer. In other words, bulk should rather signify wine that is shipped in “large volume” container and then repackaged in smaller container before it reaches the consumer. Let us hope that the OIV definition will evolve.
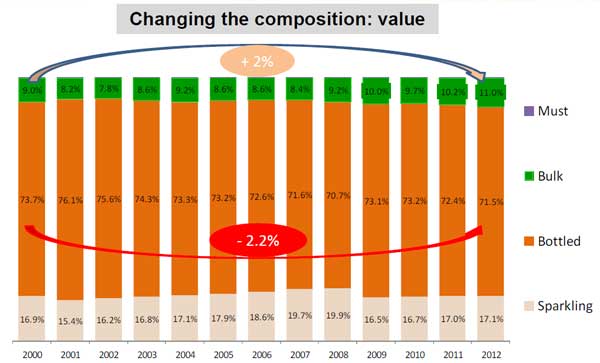
This is consistent with the evolution of the value of bulk wine trade that went up 18% in 2012 (from 2011) whereas the volume of bulk wine trade went down 4.2%. (Estimations of the 11 major exporters by “GTA; elaborated by OeMv” and presented by the OIV.) Over the full period 2000-2012 “bulk” has gained 2% (2 percentage points) in value, representing 11%, up from 9%, of the value of traded wine in 2012. Bottled wine has lost 2% (percentage points) in value over the period to reach 71.5% of the trade value in 2012.
A likely explanation for this is that the trade in “real” bulk wine (cf. what I say about the bulk definition above), that is traded at very low prices, is shrinking, but that the trade in bag-in-box wine is growing. Bag-in-box wine is likely to be traded at significantly higher prices than “real” bulk wine. And therefore using the current definition of “bulk” the value is increasing although the “true bulk” (wine that will be repackaged before reaching the consumer) is not increasing in value. However, this is only my hypothesis!
Time to change the bulk wine definition!
Sparkling wine trade stable
It is easy to think that the international trade in sparkling wine is growing. There is great demand for champagne and other sparkling wine types also benefit from increasing demand. However, this hypothesis is contradicted by the OIV data.
The numbers show a quite different picture: the value of trade in sparkling wine has remained stable 2000-2012. Sparkling wine accounts for around 17% of international wine trade.
I find this quite surprising and have no good explanation. Do you have any explanation?
The world’s biggest wine exporters: France far ahead, in value
There is much talk about France’s weakening position on the global wine market and there may be good reasons for the French to be concerned. However, France is by far the biggest exporter of wine in value, exporting 7.8 billion euro worth of wine in 2012, up 8.9% from 2011.
In second place comes Italy exporting for 4.7 bn euro wine in 2012, up 6.5% on 2011, which is 60% of France’s exports.
In third place we have Spain (2.4 bn euro, +6.5%).
But after the top three we have three New World countries: Australia (1.5 bn euro, +6.8%), Chile (!) (1.4 bn euro, + 14.7%), and the USA (1.1 bn euro, +11.5%).
World’s biggest wine exporters, counted in value (2012, source: GTA, OIV, OeMv):
- France, 7.8 bn euro
- Italy, 4.7 bn euro
- Spain, 2.4 bn euro
- Australia, 1.5 bn euro
- Chile, 1.4 bn euro
- USA, 1.1 bn euro
- Germany, 973 M euro
- New Zealand, 767 M euro
- Argentina, 711 M euro
- Portugal, 707 M euro
- South Africa, 566 M euro
World’s biggest wine exporters, counted in volume, the picture is very different (2012, source GTA, OIV, OeMv):
- Italy, 2120 million litres
- Spain, 1947 M l
- France, 1499 M l
- Chile, 751 M l
- Australia, 734 M l
- South Africa, 413 M l
- USA, 401 M l
- Germany, 396 M l
- Argentina, 365 M l
- Portugal, 339 M l
- New Zealand, 176 M l
It is interesting to take a look at the combination of these two numbers: what is the average price per litre that the top wine exporters achieve. The ranking:
- France, 5.23 euro/litre
- New Zealand, 4.36 e/l
- USA, 2.69 e/l
- Germany, 2.46 e/l
- Italy, 2.21 e/l
- Portugal, 2.09 e/l
- Australia, 2.07 e/l
- Argentina, 1.95 e/l
- Chile, 1.86 e/l
- South Africa, 1.37 e/l
- Spain, 1.21 e/l
The “traditional” wine countries achieve the highest per litre prices for their wines with France solidly ahead. Some of the New World “traditional” wine exporters also achieve very good prices for their wines.
That South Africa, Chile and Argentina would be towards the bottom of the list is also no surprise. They are known for being big exporters of low-priced bulk wines. Australia is not quite yet out of the “cheap bulk” league.
What I do find surprising though is that out of the eleven top wine exporters Spain is the country that, by a solid margin, gets the worst price for its wines. Spanish wines are paid only 1.21 euro per litre, 16 cent cheaper than the next cheapest wine supplier, South Africa. There are perhaps good reasons for the Spanish producers to be concerned? Concerned about value added. Looking back one year more, to 2011, the situation was even worse. In 2011 Spain only received on average 0.98 euro per litre wine exported…
The world market is dominated by the eleven big countries
The above numbers cover only the eleven biggest exporters. These countries account for almost 90% of the total value of wines exported and more than 92% of the total volume of wine exported, according to the OIV numbers!
Old World vs New World exports
It is interesting to compare the five Old World exporting countries with the six New World countries on the lists above. (Again, the below numbers only take into account the top eleven exporters.)
World wine export value
Old World:
- 16.6 bn euro in 2012, up 7.2% from 15.5 bn € in 2011
- 66% of world total exports (in value)
New World:
- 6 bn euro in 2012, up 11.7% from 5.4 bn in 2011
- 21% of world total exports
World wine export volumes
Old World:
- 63 million hectolitres in 2012, down -6.2% from 2011
- 64% of world total exports (in volume)
New World:
- 28 million hectolitres in 2012, up 6.4% from 2011
- 29% of world total exports
Both in value and in volume the New World countries show a better export performance than Old World exporters.
However, in average price euro/litre the Old World is still ahead and even better performing: Old World €/l prices progressed 14% in 2012 whereas New World average prices grew with “only” 5%.
The myth of shrinking French wine exports
Let me just add one thing about France. It is sometimes said that exports of French wine is shrinking, sometimes as an illustration of the lack of French sales and marketing talent.
This is wrong. French wine exports are not really shrinking. Exports from France grew from 5.5 billion euro in 2000 to 7.8 billion euro in 2012, an increase with 42%.
However, there is still reason for French wine producers to be concerned since the market share of French wine on the world market for wine exports is indeed shrinking.
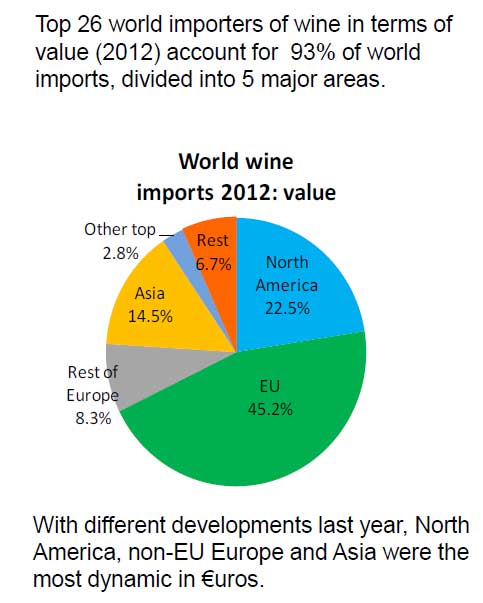
Wine imports
European countries are the biggest wine importers, accounting for 45% of all wine imports. North America is the second biggest importer with 22%, followed by Asia with 14%:
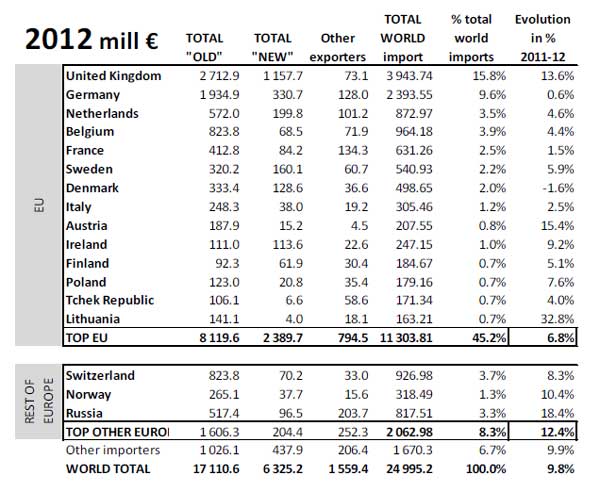
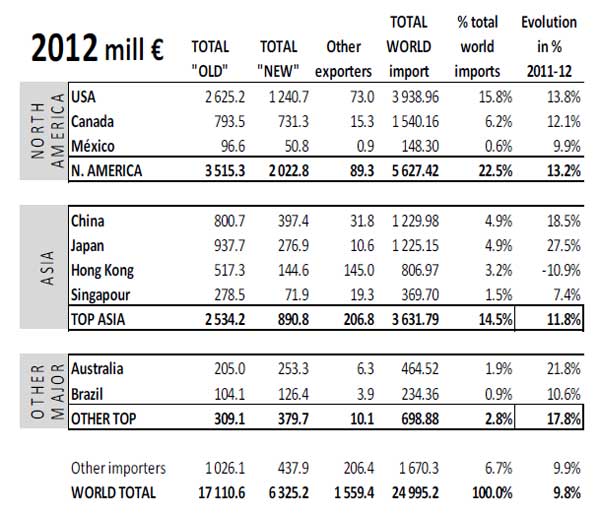
The world’s biggest wine importers, in value, 2012, millions euro:
- United Kingdom, 3944 M€
- USA, 3938
- Germany, 2393
- Canada, 1540
- China, 1229
- Japan, 1225
- Belgium, 964
- Switzerland, 925
- Netherlands, 872
- Russia, 817
- Hong Kong, 806
- France, 631
- Sweden, 540
- Denmark, 498
- Australia, 464
- Singapore, 369
- Norway, 318
- Italy, 305
- Ireland, 247
- Brazil, 234
- Austria, 207
- Finland, 184
Some charts to illustrate more details:
Who imports New World wine and Old World wines?
It is particularly interesting to look at the split between imports from Old World producers and New World producers.
Some markets are very traditional, mainly importing Old World wines:
- Germany (80% of imports from “Old World”),
- Belgium (85%),
- France (65%, vs 13% “New” and 21% “other”),
- Switzerland (89%),
- Norway (83%),
- Japan (77%),
- Russia (63%) etc.
Other countries are more oriented to wines from the New World wine producers:
- The UK (30% new world),
- Sweden (30%),
- Finland (34%),
- USA (31%),
- Canada (47%),
- China (32%), etc.
A few countries even import more from New World wine producers than from the Old World:
- Ireland (!),
- Australia, and
- Brazil.
The picture is not always what one would expect, nor for the evolution 2011-2012.
Some more remarks on curios data:
- China is a big importer of New World wines, 32% of total.
- Norway is comparatively little interested in New World wines, importing 83% from Old World countries (vs 12% New World). Sweden on the other hand is very fond of New World wine, sourcing 30% of imports from the New World (vs 62% from Old World). Curious contrast between two countries that usually do things very similarly and that both have a monopoly. What can be the reason?
- China and Japan imports about the same amount of wine (still in value). Both account for just under 5% of world imports.
- Japan’s imports grew faster than those of China in 2012! +28% compared to +18%.
- Denmark and Hong Kong were the only two (major) countries that saw falling wine imports in 2012 (compared to 2011): -1.6% and -11%. In the case of Hong Kong perhaps it is due to a cooling off of the wine investment and auction market. But what is the cause in Denmark?
More
This is the fifth article in the series on global vineyard, grape growing, wine production, wine consumption, and wine trade statistics based on the latest OIV report.
- Part 1: The world’s grape growing (vineyard) surface area
- Part 2: The world’s grape production 2000-2012
- Part 3: The world’s wine production 2000-2012
- Part 4: The world’s wine consumption 2000-2012
- Part 5: The world trade in wine 2000-2012
- Part 6: World wine market, implications for winemakers, consumers and policy-makers
Source: All numerical statistics come from the OIV, International Organisation of Vine and Wine.
Note from the OIV on statistic for this article:
Data in collaboration with the Spanish Observatory of Wine Markets (OeMv). Data for world trade are taken from GTA, which, in turn, take them from official administration bodies in more than 80 countries of the world. Not all countries are, therefore, included. (Limited to 80 countries.)
[box type=”info” style=”rounded” border=”full”]Trade is what the wine maker lives from. He needs to make his wines known. The wine consumer and wine buyer has a wide range of options to discover wines, new and old, to buy. One of the very best ways to discover some of the top quality wine producers is on a wine and food tour. Take a look at what tours BKWine has to offer.[/box]