

Global grape production: short term drop, long term rise, big shift away from Europe, productivity increasing
Global grape production has seen a slight drop in 2012 from 2011 but has since 2000 seen a slight increase. The big change is a shift from Europe that has dropped from almost 63% to 40% of world grape production. The big increases have been in Asia and in the Americas.
The other day I looked at the global and country statistics for vineyard surface area. Today it is time for global grape production. All numbers come from the recent OIV (International Organisation of Vine and Wine) report.
Since 2000 the world’s grape production has gone up somewhat. It is not a great increase, from 648 million quintals to 691 million quintals in 2012, in other words a 7% increase over 12 years, with an average of 664 Mql.
| World Grape Production, million quintals (100 kg) | |||||||||||||
|---|---|---|---|---|---|---|---|---|---|---|---|---|---|
| 2000 | 2001 | 2002 | 2003 | 2004 | 2005 | 2006 | 2007 | 2008 | 2009 | 2010 | 2011 | 2012 | avg. |
| 648 | 611 | 615 | 631 | 681 | 674 | 670 | 655 | 674 | 682 | 688 | 714 | 691 | 664 |
Quintals is an unusual measure that equals 100kg. Perhaps it is the standard in grape harvest reporting to the OIV, but apart from that I have only seen it in Italy. In Italy vineyard yield is often measured in quintals per hectare, and not hectolitres per hectare that is the common measure in many other places in Europe. But hectolitres is of course only relevant for wine production…
Divide the quintals with ten if you prefer to measure in (metric) tonnes: The world grape production in 2012 was 69 million tonnes.
Important: the statistics show grape production for all usage, not only wine!
Europe’s share of world grape production shrinking dramatically
There has been a dramatic change in where in the world these grapes are grown though:
In 2000 62.5% of all the world’s grapes came from Europe.
In 2012 that number has shrunk to 39% of the world’s grapes.
Europe’s total grape production in 2000 was 405 Mql. In 2012 it was only 269 Mql. Europe has decreased its grape production with 136 Mql, a decrease with -34%, a third of the total output in 2000.
The regions that have increased their share of grape production are:
Asia: up from 19.4% to 31.2% of the world’s grape production between 2000 and 2012.
America: up from 12% to 21%.
Or to illustrate the shift away from Europe even more:
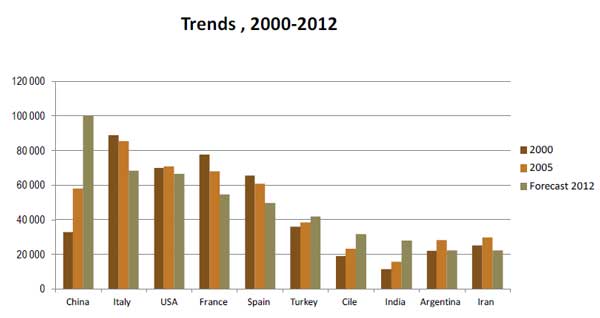
The biggest grape producing countries: the winner is, China!
The top list of grape producing countries today (2012):
- China
- Italy
- USA
- France
- Spain
- Chile
- India
- Argentina
- Iran
I expect that very little of what is produced in Iran is turned into wine (but no doubt some is). Also in China much of the production does not end up as wine.
In 2005 the top list looked like this:
- Italy
- USA
- France
- Spain
- China
The top four on the 2005 ranking have all shrunk their production since then. China has on the other hand grown dramatically.
Today China accounts for 14% of the world production of grapes and Italy and the USA (nr 2 and nr 3 on the list) each make 10%.
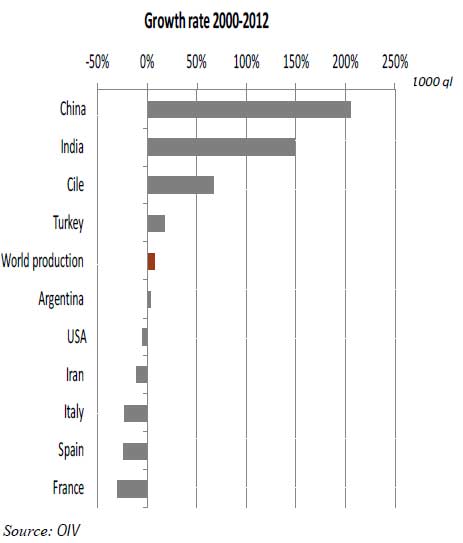
Growth most marked in China, India and Chile
By far the biggest increase in grape production has happened in China (excluding countries with very small production). China has increased its production more than 200% since 2000 and now has an output of 100 Mql. China’s grape production is now almost 40% of all of Europe’s.
Two other countries have also significantly increased the production over the period 2000-2012: India with 150% to reach almost 30 Mql and Chile with around 65% to reach almost 35 Mql.
The “traditional” big grape producers – Italy, USA, France, and Spain – have all reduced their output.
Yield varies dramatically: Europe lowest, Americas highest, increasing for non-wine use
The yield is a very important parameter in vine growing for making wine. It is generally assumed that a lower yield makes for a better wine. This is not always the case.
When it comes to grape yield in the OIV statistics we have to be careful with the interpretation. In this case yield means quantity of grapes per hectare of vineyards. Two important notes: 1) it is grapes for all uses (not only wine), and 2) the vineyard area used for the calculation is the total acreage, including vines not in production.
So let’s take a look at the chart:
A few things to note, from a wine perspective:
- Grape yield is by a big margin lowest in Europe. One should be careful to interpret this as meaning “Europe is more quality conscious”. A more correct interpretation is probably: in Europe almost all grapes are used for wine production and in wine production yields are lower than in vineyards used for raisins, table grapes, or juice.
- Grape yields are low in “mainly wine” countries, and higher in countries with more “other use”, table grapes, raisins and juice production (an assumption that will be tested in the next article on global wine production)
- Yields have been quite stable in Europe
- Yields have gone down in Australia (the dominant country in Oceania)
- Yields have increased dramatically in Asia
The yield in Europe is around 65 quintals per hectare. If we translate that to hectolitres per hectares it becomes, with a very approximate conversion, some 40-45 hectolitres per hectare. It is surprisingly low but it is probably wildly off the mark from what the “real” vineyard wine yields (measured as vine production on productive vineyard surface) are in Europe. The number includes vineyards not yet in production and grapes for all uses. The “real” yield is probably much higher.
The global trend in grape yield is upwards. The global yield has increased form a bit over 80 ql/ha in 2000 to 91.7 quintals per hectare in 2012. As the OIV notes: “productivity is growing especially in the countries that produce non-fermented products and table grapes.”
More
This is the second article in the series on global vineyard, grape growing, wine production, wine consumption, and wine trade statistics based on the latest OIV report.
- Part 1: The world’s grape growing (vineyard) surface area
- Part 2: The world’s grape production 2000-2012
- Part 3: The world’s wine production 2000-2012
- Part 4: The world’s wine consumption 2000-2012
- Part 5: The world trade in wine 2000-2012
- Part 6: World wine market, implications for winemakers, consumers and policy-makers
Source: All numerical statistics come from the OIV, International Organisation of Vine and Wine.
[box type=”info” style=”rounded” border=”full”]If you want to inspect the grapes yourself at close hand you can join a wine tour in grape harvest season with BKWine. Perhaps you can even do a bit of grape harvesting yourself![/box]


5 Responses
Theres someting wrong with OIVs numbers.Turkey is regularly either 4th, 5th or 6th depending on the year, biggest grape producers in the world, wine-vineyard acreage increasing annualy. About 10 % of total grape is made into wine. Just wanted to point that out.
Vinoman,
Yes, that sounds likely. I will check back with them and see if there’s a mistake.
Turkey is one of the biggest vineyard countries
https://www.bkwine.com/features/winemaking-viticulture/worlds-grape-growing-vineyard-acreage/
number 5, after China.
Surely they must be getting some grapes from all those vineyards!
-Per
Vinoman,
Data on grape production now updated. Turkey comes in 6th place.
Thanks for spotting the omission!
We are proud to be indian …
We icreas iur production day by day…and quality